St. Charles: Fire Incidents, Illinois (IL)
Where are fire incidents reported in St. Charles, IL
Something went wrong! Please refresh the page.
| Fire incidents reported | |
|---|---|
| Sreet name | Count |
| MAIN ST | 248 |
| RANDALL RD | 72 |
| 5TH AVE | 44 |
| WESSEL CT | 44 |
| CAMPTON HILLS RD | 42 |
| WALNUT DR | 42 |
| KIRK RD | 38 |
| SILVER GLEN RD | 32 |
| 3RD ST | 30 |
| DEAN ST | 30 |
| LINCOLN HWY | 28 |
| PRODUCTION DR | 26 |
| ROUTE 25 | 26 |
| 15TH ST | 24 |
| COVINGTON CT | 24 |
| ILLINOIS AVE | 24 |
| BOLCUM RD | 22 |
| ROUTE 38 | 22 |
| 2ND ST | 20 |
| 6TH ST | 20 |
| DUNHAM RD | 20 |
| GENEVA RD | 20 |
| ROUTE 31 | 20 |
| 12TH ST | 16 |
| 5TH ST | 16 |
| 7TH ST | 16 |
| TYLER RD | 16 |
| VILLA MARIA RD | 16 |
| BROWN RD | 14 |
| CAMPTON HILLS RD. | 14 |
| Other | 233 |
2002 - 2011 National Fire Incident Reporting System (NFIRS) incidents
- Incident types reported to NFIRS in St. Charles, IL
- 4,61437.5%Rescue & EMS
- 2,57720.9%Hazardous Condition
- 2,48520.2%False Alarm
- 1,25910.2%Fire
- 8336.8%Service Call
- 5114.2%Good Intent Call
- 150.1%Overpressure Rupture
- 130.1%Severe Weather
- Fire incident types reported to NFIRS in St. Charles, IL
- 56845.1%Outside Fires
- 53242.3%Structure Fires
- 13811.0%Mobile Property/Vehicle Fires
- 211.7%Other
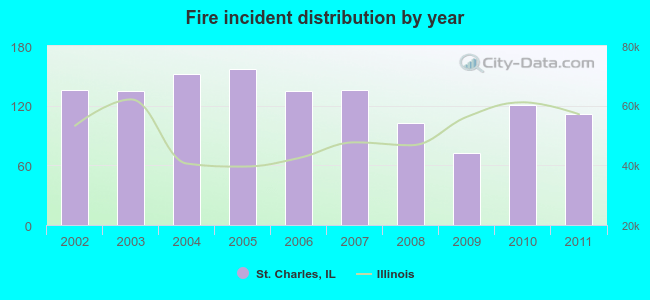 Based on the data from the years 2002 - 2011 the average number of fire incidents per year is 126. The highest number of reported fire incidents - 157 took place in 2005, and the least - 72 in 2009. The data has a declining trend.
 The median response time based on all reported fire incidents is 5 minutes. This is close to the Illinois median value.
The median response time in St. Charles, IL compared to nearest cities:
(Note: Based on data for all years, including only cities with at least 500 fire incidents)
| St. Charles: | 5 minutes |
| Geneva: | 5 minutes |
| Batavia: | 5 minutes |
| South Elgin: | 5 minutes |
| West Chicago: | 6 minutes |
| North Aurora: | 5 minutes |
| Bartlett: | 5 minutes |
| Elburn: | 8 minutes |
| Winfield: | 5 minutes |
 Based on the reports from the years 2002 - 2011 the average number of fire-related casualties per year is 1. The highest number of reported casualties - 3 took place in 2007, and the lowest - 0 in 2003. The data has a decreasing trend.
The average number of injuries per 1,000 fire incidents is 8. This indicator was the highest - 22 in 2007, and the lowest 0 in 2003. The trend for casualties per 1,000 fires is dropping. Compared to the state value the number of casualties per 1,000 fires is lower.
Based on the reports from the years 2002 - 2011 the average number of fire-related casualties per year is 1. The highest number of reported casualties - 3 took place in 2007, and the lowest - 0 in 2003. The data has a decreasing trend.
The average number of injuries per 1,000 fire incidents is 8. This indicator was the highest - 22 in 2007, and the lowest 0 in 2003. The trend for casualties per 1,000 fires is dropping. Compared to the state value the number of casualties per 1,000 fires is lower.Casualties per 1,000 incidents in St. Charles, IL compared to nearest cities:
(Note: Based on data for all years, including only cities with at least 500 fire incidents)
| St. Charles: | 7.9 |
| Geneva: | 4.5 |
| Batavia: | 10.8 |
| South Elgin: | 10.9 |
| West Chicago: | 20.6 |
| North Aurora: | 0.0 |
| Bartlett: | 11.6 |
| Elburn: | 1.0 |
| Winfield: | 3.4 |
 31.9% incidents where reported in the morning and 68.1% in the evening. The most fires (16.8%) took place on Wednesday, and the least (13.3%) on Tuesday.
 Based on the 1,259 fire incident reports from years 2002 - 2011 most fires (12.7%) took place during April, and the least (4.5%) in February.
 Out of all 12,313 cases reported during the years 2002 - 2011, the most belonged to the categories: Rescue & EMS (37.5%), Hazardous Condition (20.9%), and False Alarm (20.2%).
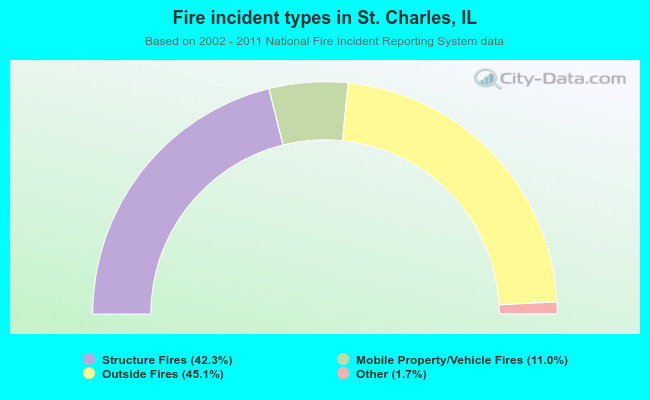 When looking into fire subcategories, the most incidents belonged to: Outside Fires (45.1%), and Structure Fires (42.3%).