Statesville: Fire Incidents, North Carolina (NC)
Where are fire incidents reported in Statesville, NC
Something went wrong! Please refresh the page.
| Fire incidents reported | |
|---|---|
| Sreet name | Count |
| TURNERSBURG HWY | 186 |
| FRONT ST | 178 |
| BROAD ST | 160 |
| SALISBURY HWY | 150 |
| I-77 | 144 |
| WILKESBORO HWY | 130 |
| OLD MOUNTAIN RD | 120 |
| MOCKSVILLE HWY | 118 |
| BUFFALO SHOALS RD | 116 |
| SALISBURY RD | 110 |
| TAYLORSVILLE HWY | 104 |
| I-77 FWY | 98 |
| CENTER ST | 92 |
| I-40 FWY | 88 |
| AMITY HILL RD | 82 |
| OLD MOCKSVILLE RD | 82 |
| I-40 HWY | 80 |
| SHELTON AVE | 78 |
| I40 | 74 |
| I77 | 74 |
| I40 HWY | 68 |
| GLENWAY DR | 66 |
| I-77 HWY | 64 |
| MCNESS RD | 62 |
| ISLAND FORD RD | 60 |
| WILSON LEE BLVD | 58 |
| CROSSROADS DR | 54 |
| DAVIE AVE | 54 |
| CHIPLEY FORD RD | 52 |
| EUFOLA RD | 52 |
| Other | 3,246 |
2002 - 2018 National Fire Incident Reporting System (NFIRS) incidents
- Incident types reported to NFIRS in Statesville, NC
- 18,06645.7%Rescue & EMS
- 6,10015.4%Fire
- 4,54711.5%Hazardous Condition
- 3,7939.6%False Alarm
- 3,6869.3%Good Intent Call
- 2,8287.2%Service Call
- 3090.8%Severe Weather
- 1100.3%Overpressure Rupture
- 550.1%Special Incident
- Fire incident types reported to NFIRS in Statesville, NC
- 2,77645.5%Structure Fires
- 2,13034.9%Outside Fires
- 89614.7%Mobile Property/Vehicle Fires
- 2984.9%Other
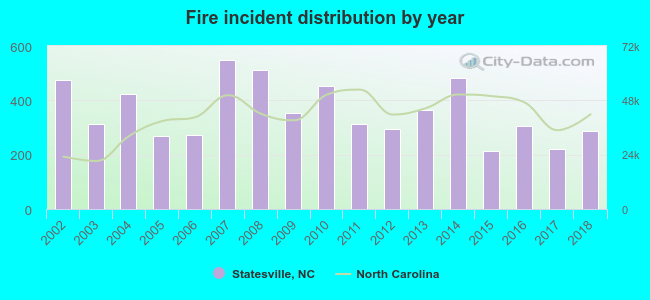 According to the data from the years 2002 - 2018 the average number of fires per year is 359. The highest number of reported fire incidents - 548 took place in 2007, and the least - 214 in 2015. The data has a declining trend.
The average number of yearly fire incidents per 10k residents in Statesville, NC compared to nearest cities:
(Note: Based on data for the last 3 years, including only cities with population 5,000 and above)
| Statesville: | 105.5 |
| Mooresville: | 71.8 |
| Mocksville: | 327.2 |
| Conover: | 47.5 |
| Davidson: | 19.2 |
| Newton: | 24.1 |
| Cornelius: | 14.8 |
| Salisbury: | 116.0 |
| Kannapolis: | 24.5 |
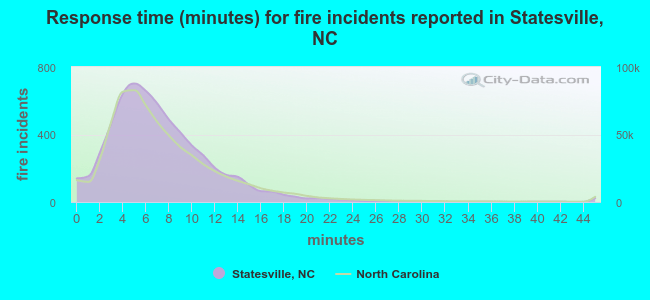 The median response time based on all reported fire incidents is 6 minutes. This is about the same as the North Carolina median value.
The median response time in Statesville, NC compared to nearest cities:
(Note: Based on data for all years, including only cities with at least 500 fire incidents)
| Statesville: | 6 minutes |
| Troutman: | 7 minutes |
| Catawba: | 6 minutes |
| Sherrills Ford: | 5 minutes |
| Harmony: | 7 minutes |
| Mooresville: | 6 minutes |
| Claremont: | 5 minutes |
| Taylorsville: | 6 minutes |
| Mocksville: | 7 minutes |
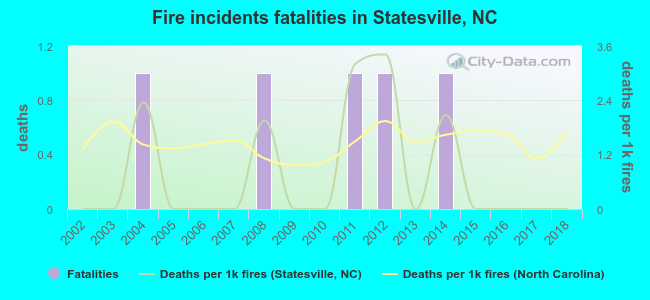 According to the reports from the years 2002 - 2018 the average number of fire-related yearly deaths is 0. The highest number of deaths - 1 took place in 2004, and the lowest - 0 in 2002. The data has a constant trend.
The average number of fatalities per 1,000 fire incidents is 1. This indicator was the highest - 3 in 2012, and the lowest 0 in 2002. The trend for deaths per 1,000 fire incidents is constant. Compared to the state value the number of fatalities per 1,000 incidents is lower.
According to the reports from the years 2002 - 2018 the average number of fire-related yearly deaths is 0. The highest number of deaths - 1 took place in 2004, and the lowest - 0 in 2002. The data has a constant trend.
The average number of fatalities per 1,000 fire incidents is 1. This indicator was the highest - 3 in 2012, and the lowest 0 in 2002. The trend for deaths per 1,000 fire incidents is constant. Compared to the state value the number of fatalities per 1,000 incidents is lower.Deaths per 1,000 incidents in Statesville, NC compared to nearest cities:
(Note: Based on data for all years, including only cities with at least 2,500 fire incidents)
| Statesville: | 0.8 |
| Mooresville: | 0.0 |
| Mocksville: | 1.7 |
| Salisbury: | 1.8 |
| Hickory: | 0.8 |
| Lincolnton: | 2.4 |
| Concord: | 0.5 |
| Lexington: | 0.0 |
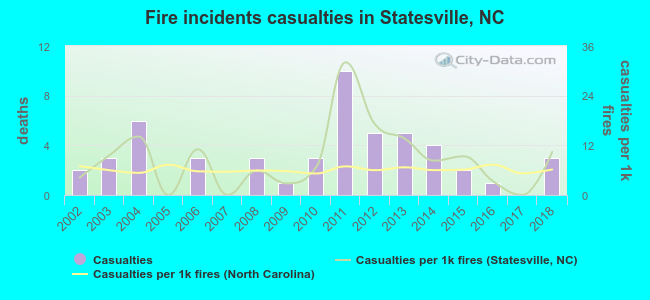 According to the reports from the years 2002 - 2018 the average number of fire-related casualties per year is 3. The highest number of reported casualties - 10 took place in 2011, and the lowest - 0 in 2005. The data has a rising trend.
The average number of casualties per 1,000 fire incidents is 9. This indicator was the highest - 32 in 2011, and the lowest 0 in 2005. The trend for injuries per 1,000 fires is growing. Compared to the North Carolina value the number of injuries per 1,000 fire incidents is higher.
According to the reports from the years 2002 - 2018 the average number of fire-related casualties per year is 3. The highest number of reported casualties - 10 took place in 2011, and the lowest - 0 in 2005. The data has a rising trend.
The average number of casualties per 1,000 fire incidents is 9. This indicator was the highest - 32 in 2011, and the lowest 0 in 2005. The trend for injuries per 1,000 fires is growing. Compared to the North Carolina value the number of injuries per 1,000 fire incidents is higher.Casualties per 1,000 incidents in Statesville, NC compared to nearest cities:
(Note: Based on data for all years, including only cities with at least 500 fire incidents)
| Statesville: | 8.4 |
| Troutman: | 0.0 |
| Catawba: | 0.0 |
| Sherrills Ford: | 0.0 |
| Harmony: | 0.0 |
| Mooresville: | 4.0 |
| Claremont: | 0.0 |
| Taylorsville: | 1.6 |
| Mocksville: | 5.7 |
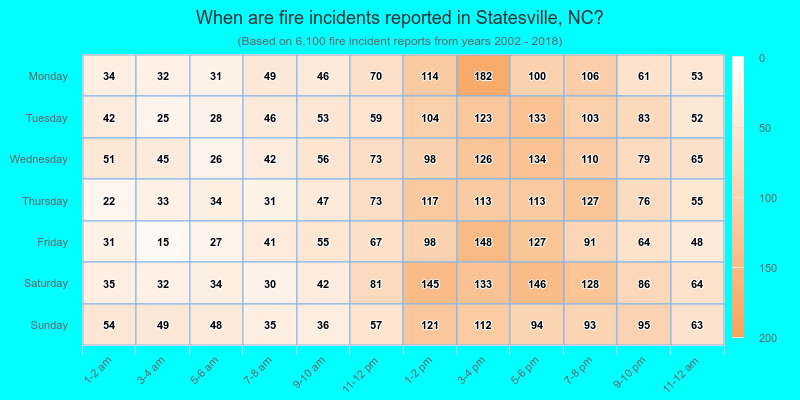
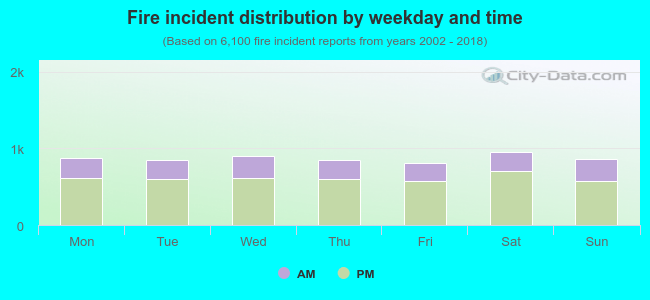 29.8% incidents where reported in the morning and 70.2% in the evening. The most fires (15.7%) took place on Saturday, and the least (13.3%) on Friday.
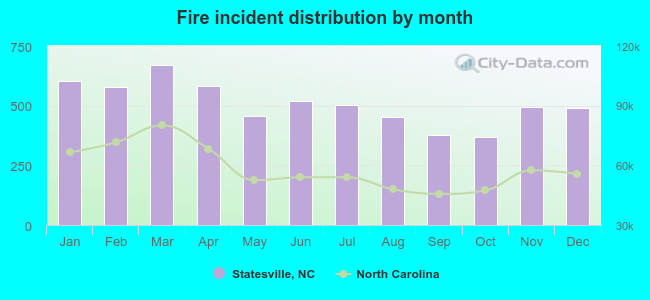 Based on the 6,100 fire incident reports from years 2002 - 2018 most fires (11.0%) took place during March, and the least (6.0%) in October.
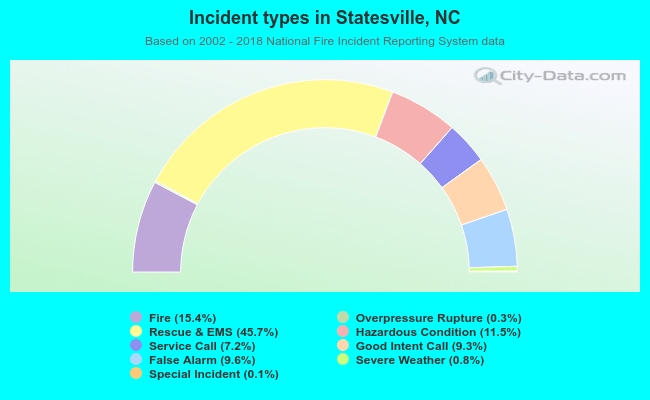 Out of all 39,494 cases reported during the years 2002 - 2018, the most belonged to the categories: Rescue & EMS (45.7%), Fire (15.4%), and Hazardous Condition (11.5%).
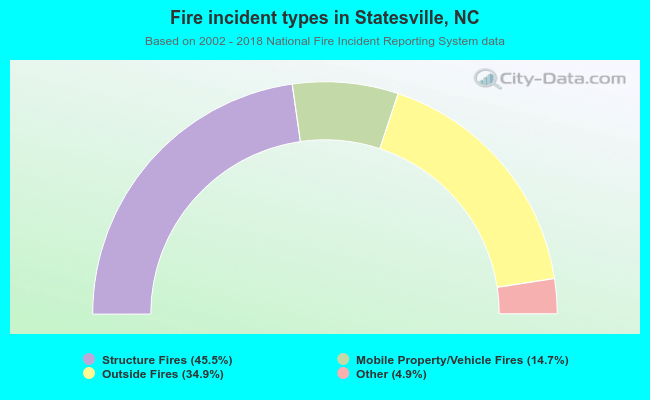 When looking into fire subcategories, the most incidents belonged to: Structure Fires (45.5%), and Outside Fires (34.9%).