Stevens Point: Fire Incidents, Wisconsin (WI)
Where are fire incidents reported in Stevens Point, WI
Something went wrong! Please refresh the page.
| Fire incidents reported | |
|---|---|
| Sreet name | Count |
| MAIN ST | 94 |
| TORUN RD | 70 |
| CHURCH ST | 68 |
| DIVISION ST | 64 |
| INTERSTATE 39 | 54 |
| RESERVE ST | 54 |
| ISADORE ST | 52 |
| SECOND ST | 52 |
| FOURTH AVE | 48 |
| MICHIGAN AVE | 48 |
| JEFFERSON ST | 42 |
| NORTH POINT DR | 42 |
| INDIANA AVE | 40 |
| WASHINGTON AVE | 38 |
| ELLIS ST | 36 |
| FRANKLIN ST | 36 |
| FIFTH AVE | 30 |
| MINNESOTA AVE | 30 |
| HWY 10 | 28 |
| PORTAGE ST | 26 |
| CLARK ST | 24 |
| SUNSET DR | 24 |
| COLLEGE AVE | 22 |
| ILLINOIS AVE | 22 |
| STANLEY ST | 22 |
| FREMONT ST | 20 |
| PRENTICE ST | 20 |
| SUNSET BLVD | 20 |
| JOHNS DR | 18 |
| WATER ST | 18 |
| Other | 340 |
2002 - 2018 National Fire Incident Reporting System (NFIRS) incidents
- Incident types reported to NFIRS in Stevens Point, WI
- 3,00438.2%Rescue & EMS
- 1,50219.1%Fire
- 1,26416.1%Hazardous Condition
- 6778.6%False Alarm
- 6638.4%Service Call
- 6057.7%Good Intent Call
- 1211.5%Overpressure Rupture
- 140.2%Special Incident
- Fire incident types reported to NFIRS in Stevens Point, WI
- 88158.7%Structure Fires
- 32121.4%Outside Fires
- 24416.2%Mobile Property/Vehicle Fires
- 563.7%Other
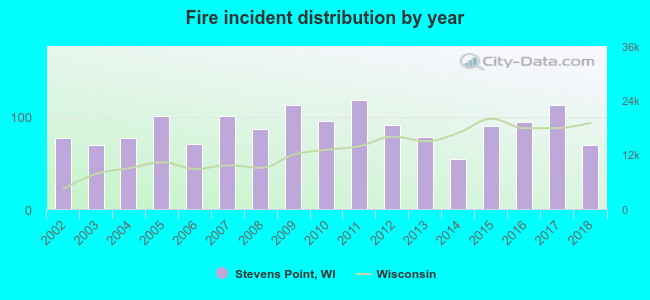 Based on the data from the years 2002 - 2018 the average number of fire incidents per year is 88. The highest number of reported fire incidents - 118 took place in 2011, and the least - 54 in 2014. The data has a dropping trend.
The average number of yearly fire incidents per 10k residents in Stevens Point, WI compared to nearest cities:
(Note: Based on data for the last 3 years, including only cities with population 5,000 and above)
| Stevens Point: | 34.8 |
| Plover: | 42.7 |
| Wisconsin Rapids: | 45.1 |
| Saratoga: | 3.9 |
| Kronenwetter: | 12.6 |
| Rothschild: | 30.8 |
| Weston: | 7.0 |
| Waupaca: | 81.4 |
| Rib Mountain: | 16.5 |
 The median response time based on all reported fire incidents is 5 minutes. This is lower than the state median value.
The median response time in Stevens Point, WI compared to nearest cities:
(Note: Based on data for all years, including only cities with at least 500 fire incidents)
| Stevens Point: | 5 minutes |
| Wisconsin Rapids: | 7 minutes |
| Nekoosa: | 9 minutes |
 Based on the reports from the years 2002 - 2018 the average number of fire-related yearly deaths is 0. The highest number of reported deaths - 3 took place in 2008, and the lowest - 0 in 2002. The data has a constant trend.
 According to the reports from the years 2002 - 2018 the average number of fire-related yearly casualties is 2. The highest number of injuries - 8 took place in 2007, and the lowest - 0 in 2002. The data has a constant trend.
The average number of injuries per 1,000 fires is 15. This indicator was the highest - 79 in 2007, and the lowest 0 in 2002. The trend for injuries per 1,000 fire incidents is constant. Compared to the state value the number of injuries per 1,000 fires is higher.
According to the reports from the years 2002 - 2018 the average number of fire-related yearly casualties is 2. The highest number of injuries - 8 took place in 2007, and the lowest - 0 in 2002. The data has a constant trend.
The average number of injuries per 1,000 fires is 15. This indicator was the highest - 79 in 2007, and the lowest 0 in 2002. The trend for injuries per 1,000 fire incidents is constant. Compared to the state value the number of injuries per 1,000 fires is higher.Casualties per 1,000 incidents in Stevens Point, WI compared to nearest cities:
(Note: Based on data for all years, including only cities with at least 500 fire incidents)
| Stevens Point: | 17.3 |
| Wisconsin Rapids: | 10.8 |
| Nekoosa: | 7.0 |
 35.2% incidents where reported in the morning and 64.8% in the evening. The most fires (16.6%) took place on Saturday, and the least (12.8%) on Sunday.
 Based on the 1,502 fires from years 2002 - 2018 most fires (12.5%) took place during April, and the least (5.7%) in September.
 Out of all 7,855 cases reported during the years 2002 - 2018, the most belonged to the categories: Rescue & EMS (38.2%), Fire (19.1%), and Hazardous Condition (16.1%).
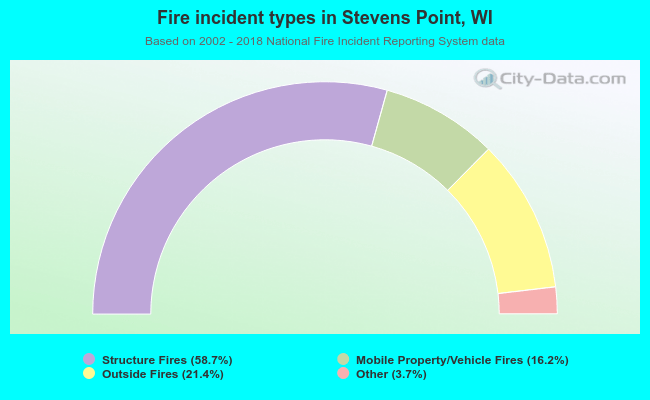 When looking into fire subcategories, the most incidents belonged to: Structure Fires (58.7%), and Outside Fires (21.4%).