Streetsboro: Fire Incidents, Ohio (OH)
Where are fire incidents reported in Streetsboro, OH
Something went wrong! Please refresh the page.
| Fire incidents reported | |
|---|---|
| Sreet name | Count |
| MILLER PKWY | 58 |
| I-80 OTP | 54 |
| FROST RD | 44 |
| SHADY LAKE DR | 44 |
| ST RT 14 | 44 |
| PORTAGE POINTE DR | 38 |
| STATE RT 14 | 38 |
| STATE RT 43 | 38 |
| STATE RT 303 | 34 |
| WELLMAN RD | 32 |
| PAGE RD | 30 |
| MILLER PKY | 28 |
| OH SR 14 9100-9900 | 28 |
| RUSSELL DR | 28 |
| DIAGONAL RD | 26 |
| AURORA HUDSON RD | 22 |
| MILLER | 22 |
| OH SR 303 1300-2399 | 22 |
| SEASONS RD | 22 |
| STONE RD | 22 |
| BRIAR DR | 20 |
| ST RT 303 | 20 |
| BRIDGEPORT AVE | 18 |
| FROST 000-1100 RD | 18 |
| GAYNELLE AVE | 18 |
| MARKET SQUARE DR | 18 |
| MONDIAL PKWY | 18 |
| OH SR 43 9100-10149 | 18 |
| ST RT 43 | 18 |
| SINGLETARY DR | 16 |
| Other | 204 |
2002 - 2018 National Fire Incident Reporting System (NFIRS) incidents
- Incident types reported to NFIRS in Streetsboro, OH
- 7,29060.3%Rescue & EMS
- 1,1059.1%False Alarm
- 1,0608.8%Fire
- 1,0388.6%Hazardous Condition
- 9447.8%Service Call
- 5874.9%Good Intent Call
- 290.2%Overpressure Rupture
- 210.2%Special Incident
- 200.2%Severe Weather
- Fire incident types reported to NFIRS in Streetsboro, OH
- 54951.8%Structure Fires
- 31529.7%Outside Fires
- 17816.8%Mobile Property/Vehicle Fires
- 181.7%Other
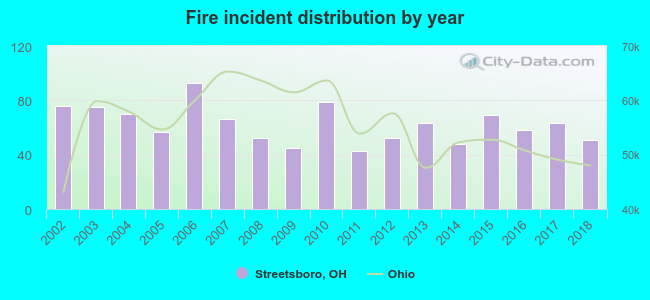 Based on the data from the years 2002 - 2018 the average number of fires per year is 62. The highest number of reported fires - 93 took place in 2006, and the least - 43 in 2011. The data has a decreasing trend.
The average number of yearly fire incidents per 10k residents in Streetsboro, OH compared to nearest cities:
(Note: Based on data for the last 3 years, including only cities with population 5,000 and above)
| Streetsboro: | 35.3 |
| Hudson: | 12.2 |
| Aurora: | 19.9 |
| Kent: | 26.5 |
| Stow: | 18.6 |
| Twinsburg: | 40.7 |
| Ravenna: | 117.4 |
| Munroe Falls: | 12.6 |
| Macedonia: | 29.9 |
 The median response time based on all reported fire incidents is 6 minutes. This is similar to the Ohio median value.
The median response time in Streetsboro, OH compared to nearest cities:
(Note: Based on data for all years, including only cities with at least 500 fire incidents)
| Streetsboro: | 6 minutes |
| Hudson: | 6 minutes |
| Aurora: | 5 minutes |
| Kent: | 6 minutes |
| Stow: | 5 minutes |
| Mantua: | 9 minutes |
| Twinsburg: | 5 minutes |
| Ravenna: | 7 minutes |
| Macedonia: | 5 minutes |
 According to the data from the years 2002 - 2018 the average number of fire-related yearly casualties is 1. The highest number of reported casualties - 3 took place in 2002, and the lowest - 0 in 2005. The data has a declining trend.
The average number of injuries per 1,000 fires is 10. This indicator was the highest - 42 in 2014, and the lowest 0 in 2005. The trend for casualties per 1,000 fire incidents is dropping. Compared to the Ohio value the number of casualties per 1,000 fire incidents is lower.
According to the data from the years 2002 - 2018 the average number of fire-related yearly casualties is 1. The highest number of reported casualties - 3 took place in 2002, and the lowest - 0 in 2005. The data has a declining trend.
The average number of injuries per 1,000 fires is 10. This indicator was the highest - 42 in 2014, and the lowest 0 in 2005. The trend for casualties per 1,000 fire incidents is dropping. Compared to the Ohio value the number of casualties per 1,000 fire incidents is lower.
 31.4% incidents where reported in the morning and 68.6% in the evening. The most fires (16.1%) took place on Wednesday, and the least (11.6%) on Thursday.
 According to the 1,060 fire incident reports from years 2002 - 2018 most fires (11.3%) took place during June, and the least (5.9%) in February.
 Out of all 12,094 cases reported during the years 2002 - 2018, the most belonged to the categories: Rescue & EMS (60.3%), False Alarm (9.1%), and Fire (8.8%).
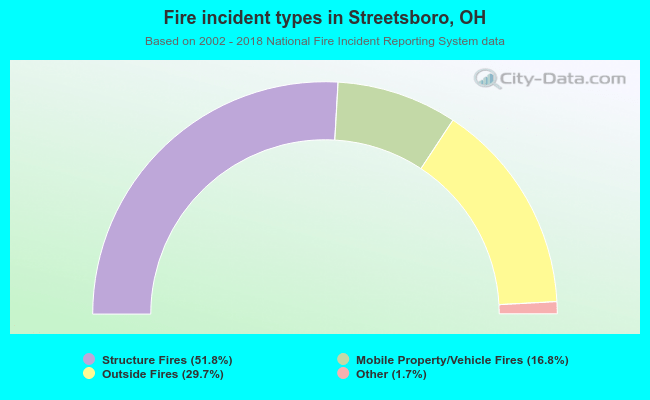 When looking into fire subcategories, the most incidents belonged to: Structure Fires (51.8%), and Outside Fires (29.7%).