Tahlequah: Fire Incidents, Oklahoma (OK)
Where are fire incidents reported in Tahlequah, OK
Something went wrong! Please refresh the page.
| Fire incidents reported | |
|---|---|
| Sreet name | Count |
| MUSKOGEE AVE | 50 |
| 510 RD | 46 |
| PARKHILL RD | 28 |
| WILLIS RD | 28 |
| MUSKOGEE | 24 |
| HWY 82 | 22 |
| 730 RD | 20 |
| ALLEN RD | 20 |
| DOWNING | 18 |
| DOWNING ST | 18 |
| HWY 82A | 18 |
| CHOCTAW | 16 |
| FOX ST | 16 |
| HWY 51 | 16 |
| PARK HILL | 16 |
| PARK HILL RD | 16 |
| 520 RD | 14 |
| 530 RD | 14 |
| ALLEN | 12 |
| HWY 10 | 12 |
| MURREL RD | 12 |
| 1704 E DOWNING | 10 |
| 465 RD | 10 |
| 640 RD | 10 |
| 750 RD | 10 |
| CHOCTAW ST | 10 |
| COLLEGE AVE | 10 |
| HWY 62 | 10 |
| KEELER DR | 10 |
| MUD VALLEY RD | 10 |
| Other | 1,683 |
2002 - 2018 National Fire Incident Reporting System (NFIRS) incidents
- Incident types reported to NFIRS in Tahlequah, OK
- 2,20941.0%Fire
- 92517.1%Rescue & EMS
- 77614.4%Hazardous Condition
- 57310.6%Good Intent Call
- 4298.0%False Alarm
- 4077.5%Service Call
- 490.9%Special Incident
- 210.4%Overpressure Rupture
- Fire incident types reported to NFIRS in Tahlequah, OK
- 1,19153.9%Outside Fires
- 55425.1%Structure Fires
- 30713.9%Mobile Property/Vehicle Fires
- 1577.1%Other
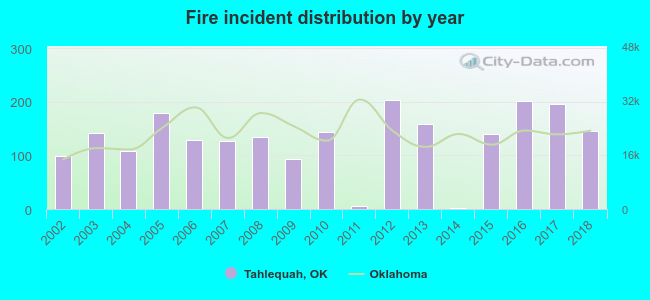 Based on the data from the years 2002 - 2018 the average number of fires per year is 130. The highest number of fire incidents - 203 took place in 2012, and the least - 2 in 2014. The data has a growing trend.
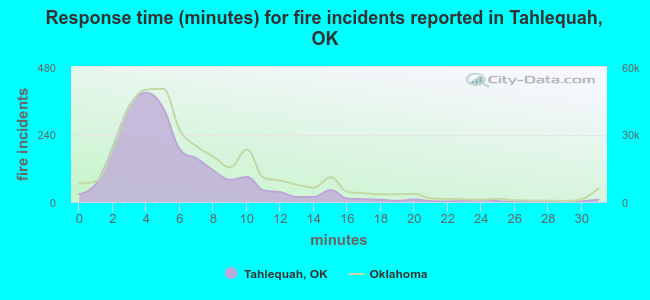 The median response time based on all reported fire incidents is 5 minutes. This is lower compared to the state median value.
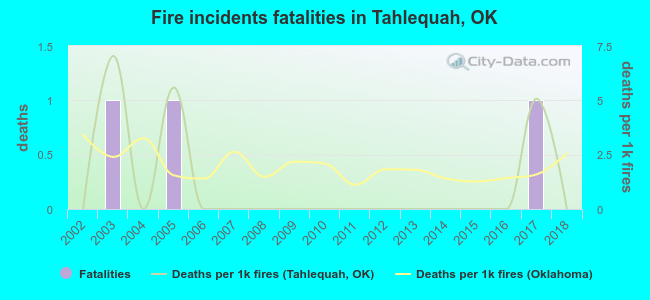 Based on the reports from the years 2002 - 2018 the average number of fire-related yearly deaths is 0. The highest number of reported deaths - 1 took place in 2003, and the lowest - 0 in 2002. The data has a constant trend.
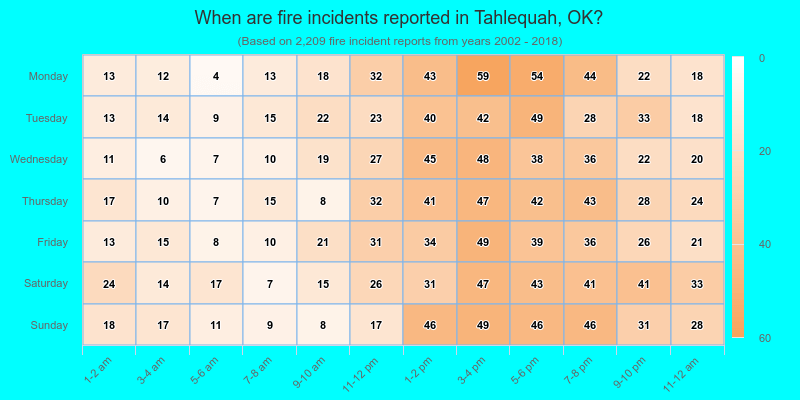
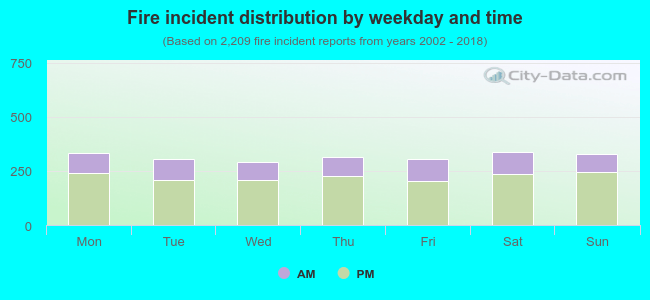 28.9% incidents where reported in the morning and 71.1% in the evening. The most fires (15.3%) took place on Saturday, and the least (13.1%) on Wednesday.
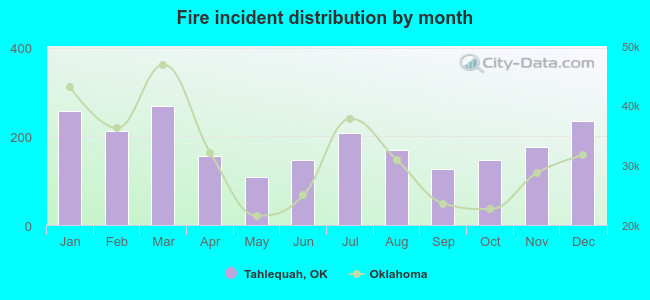 According to the 2,209 fire incident reports from years 2002 - 2018 most fires (12.2%) took place during March, and the least (4.9%) in May.
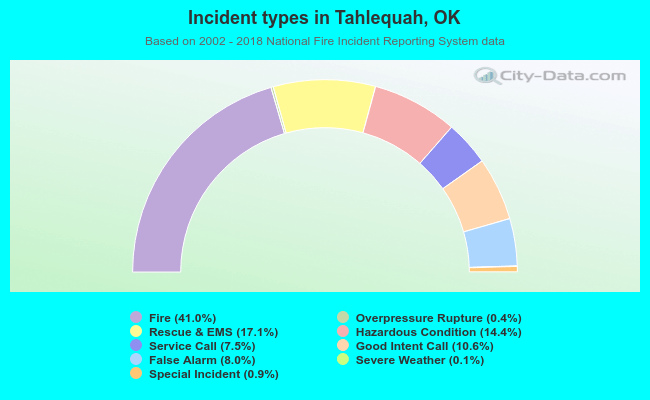 Out of all 5,394 cases reported during the years 2002 - 2018, the most belonged to the categories: Fire (41.0%), Rescue & EMS (17.1%), and Hazardous Condition (14.4%).
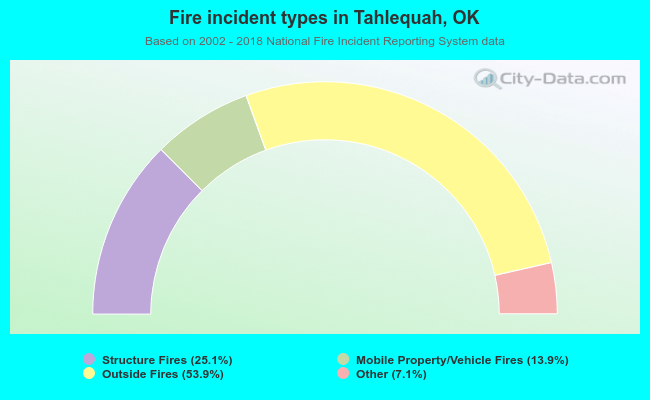 When looking into fire subcategories, the most reports belonged to: Outside Fires (53.9%), and Structure Fires (25.1%).