Tallahassee: Fire Incidents, Florida (FL)
Where are fire incidents reported in Tallahassee, FL
Something went wrong! Please refresh the page.
| Fire incidents reported | |
|---|---|
| Sreet name | Count |
| CAPITAL CIR | 830 |
| MONROE ST | 780 |
| TENNESSEE ST | 608 |
| APALACHEE PKY | 496 |
| THOMASVILLE RD | 394 |
| OLD BAINBRIDGE RD | 390 |
| MAHAN DR | 388 |
| BLOUNTSTOWN HWY | 372 |
| PENSACOLA ST | 356 |
| THARPE ST | 352 |
| JACKSON BLUFF RD | 280 |
| ADAMS ST | 236 |
| MERIDIAN RD | 216 |
| MICCOSUKEE RD | 212 |
| OCALA RD | 206 |
| MAGNOLIA DR | 202 |
| WOODVILLE HWY | 200 |
| MISSION RD | 194 |
| CRAWFORDVILLE RD | 192 |
| BALKIN RD | 158 |
| LAKE BRADFORD RD | 156 |
| OAK RIDGE RD | 150 |
| PAUL RUSSELL RD | 138 |
| CALL ST | 132 |
| CENTERVILLE RD | 132 |
| OLD ST | 128 |
| ORANGE AVE | 128 |
| BANNERMAN RD | 126 |
| HIGH RD | 126 |
| PARK AVE | 122 |
| Other | 10,940 |
2003 - 2018 National Fire Incident Reporting System (NFIRS) incidents
- Incident types reported to NFIRS in Tallahassee, FL
- 62,97848.4%Rescue & EMS
- 23,61918.1%Good Intent Call
- 19,34014.9%Fire
- 9,9577.7%Hazardous Condition
- 9,3867.2%False Alarm
- 4,0923.1%Service Call
- 5340.4%Special Incident
- 1550.1%Severe Weather
- Fire incident types reported to NFIRS in Tallahassee, FL
- 10,09452.2%Outside Fires
- 6,13931.7%Structure Fires
- 2,71114.0%Mobile Property/Vehicle Fires
- 3962.0%Other
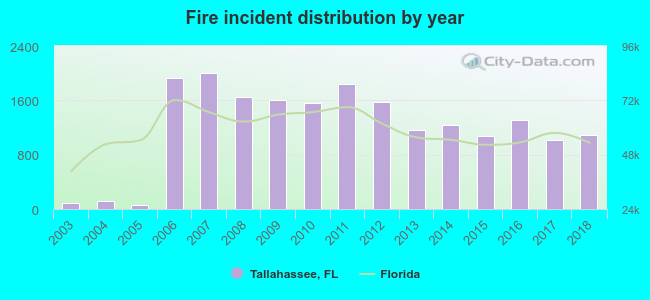 Based on the data from the years 2003 - 2018 the average number of fire incidents per year is 1,209. The highest number of fire incidents - 2,009 took place in 2007, and the least - 63 in 2005. The data has an increasing trend.
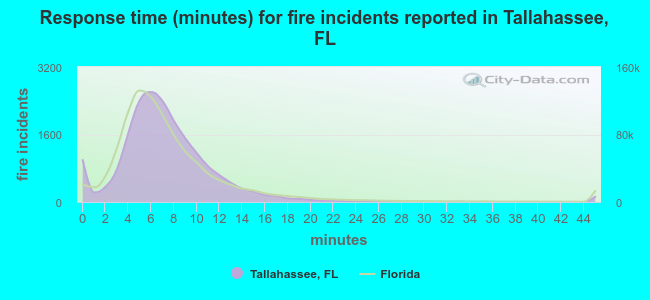 The median response time based on all reported fire incidents is 7 minutes. This is about the same as the state median value.
The median response time in Tallahassee, FL compared to nearest cities:
(Note: Based on data for all years, including only cities with at least 500 fire incidents)
| Tallahassee: | 7 minutes |
| Midway: | 11 minutes |
| Havana: | 5 minutes |
| Crawfordville: | 7 minutes |
| Quincy: | 6 minutes |
| Monticello: | 9 minutes |
| Blountstown: | 4 minutes |
| Perry: | 6 minutes |
| Madison: | 8 minutes |
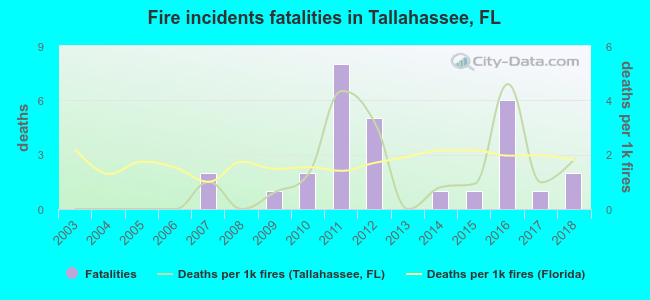 Based on the data from the years 2003 - 2018 the average number of fire-related fatalities per year is 2. The highest number of reported deaths - 8 took place in 2011, and the lowest - 0 in 2003. The data has an increasing trend.
The average number of fatalities per 1,000 fires is 1. This indicator was the highest - 5 in 2016, and the lowest 0 in 2003. The trend for fatalities per 1,000 incidents is growing. Compared to the state value the number of deaths per 1,000 fire incidents is about the same.
Based on the data from the years 2003 - 2018 the average number of fire-related fatalities per year is 2. The highest number of reported deaths - 8 took place in 2011, and the lowest - 0 in 2003. The data has an increasing trend.
The average number of fatalities per 1,000 fires is 1. This indicator was the highest - 5 in 2016, and the lowest 0 in 2003. The trend for fatalities per 1,000 incidents is growing. Compared to the state value the number of deaths per 1,000 fire incidents is about the same.Deaths per 1,000 incidents in Tallahassee, FL compared to nearest cities:
(Note: Based on data for all years, including only cities with at least 2,500 fire incidents)
| Tallahassee: | 1.5 |
| Quincy: | 4.1 |
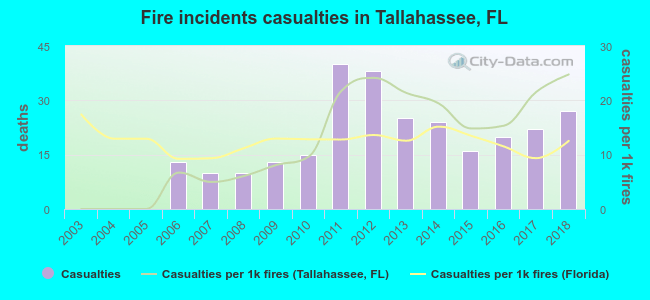 According to the data from the years 2003 - 2018 the average number of fire-related casualties per year is 17. The highest number of casualties - 40 took place in 2011, and the lowest - 0 in 2003. The data has a growing trend.
The average number of casualties per 1,000 fire incidents is 12. This indicator was the highest - 25 in 2018, and the lowest 0 in 2003. The trend for casualties per 1,000 fire incidents is growing. Compared to the state value the number of injuries per 1,000 incidents is similar.
According to the data from the years 2003 - 2018 the average number of fire-related casualties per year is 17. The highest number of casualties - 40 took place in 2011, and the lowest - 0 in 2003. The data has a growing trend.
The average number of casualties per 1,000 fire incidents is 12. This indicator was the highest - 25 in 2018, and the lowest 0 in 2003. The trend for casualties per 1,000 fire incidents is growing. Compared to the state value the number of injuries per 1,000 incidents is similar.Casualties per 1,000 incidents in Tallahassee, FL compared to nearest cities:
(Note: Based on data for all years, including only cities with at least 500 fire incidents)
| Tallahassee: | 14.1 |
| Midway: | 11.1 |
| Havana: | 1.0 |
| Crawfordville: | 3.4 |
| Quincy: | 5.3 |
| Monticello: | 6.3 |
| Blountstown: | 1.4 |
| Perry: | 0.4 |
| Madison: | 2.5 |
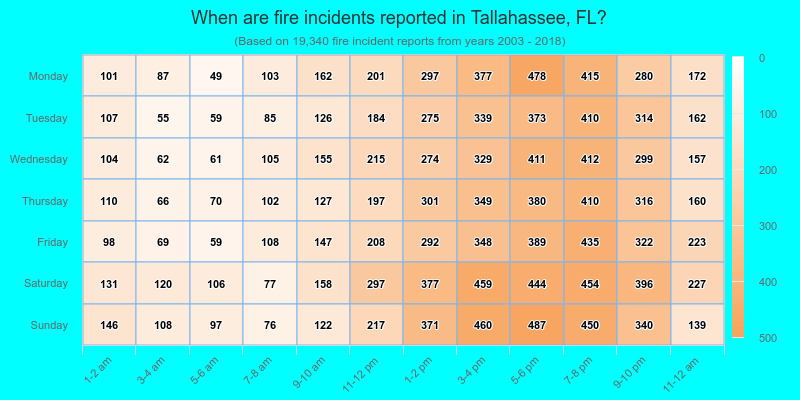
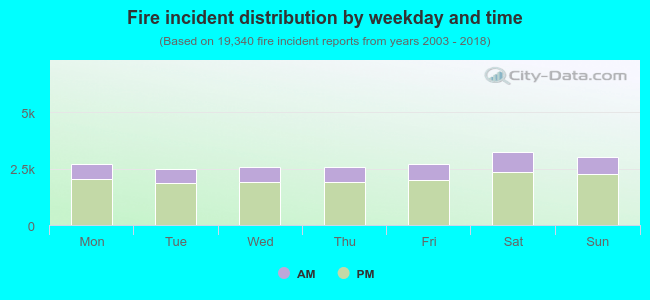 26.0% incidents where reported in the morning and 74.0% in the evening. The most fires (16.8%) took place on Saturday, and the least (12.9%) on Tuesday.
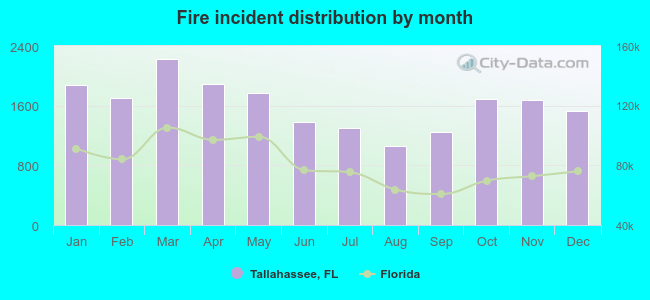 According to the 19,340 incident reports from years 2003 - 2018 most fires (11.5%) took place during March, and the least (5.5%) in August.
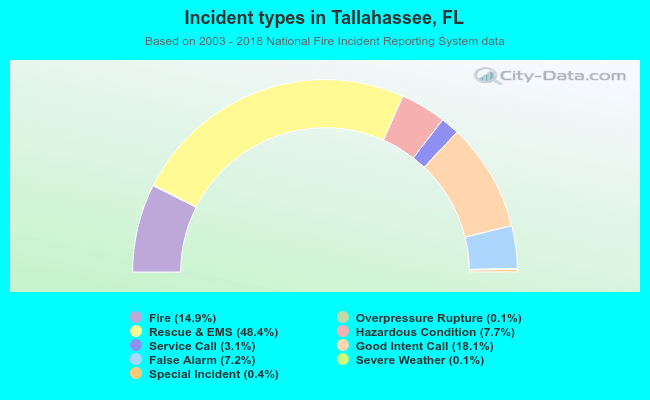 Out of all 130,136 cases reported during the years 2003 - 2018, the most belonged to the categories: Rescue & EMS (48.4%), Good Intent Call (18.1%), and Fire (14.9%).
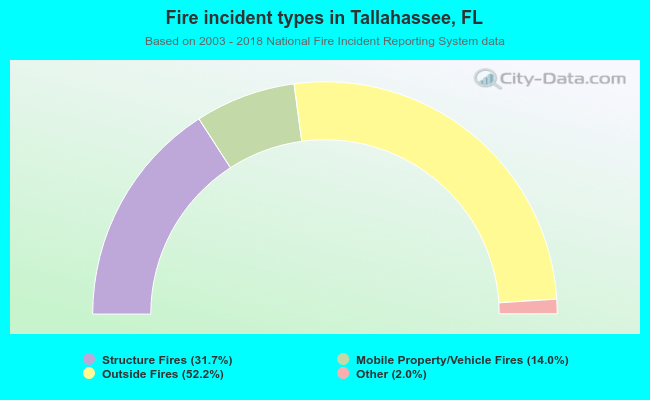 When looking into fire subcategories, the most reports belonged to: Outside Fires (52.2%), and Structure Fires (31.7%).