Terrell: Fire Incidents, Texas (TX)
Where are fire incidents reported in Terrell, TX
Something went wrong! Please refresh the page.
| Fire incidents reported | |
|---|---|
| Sreet name | Count |
| FM 429 | 184 |
| HWY 80 | 128 |
| HWY 34 | 116 |
| I20 | 96 |
| FM 2578 | 66 |
| IH 20 | 66 |
| HWY 205 | 62 |
| I-20 | 60 |
| FM 148 | 58 |
| FM 986 | 58 |
| MOORE AVE | 54 |
| COLQUITT RD | 52 |
| CR 301 | 50 |
| CR 236 | 40 |
| FM 2728 | 40 |
| ABNER RD | 38 |
| FM 1392 | 34 |
| FRANCES ST | 32 |
| CR 336 | 28 |
| FM 429 RD | 28 |
| CR 243 | 26 |
| FM 1565 | 26 |
| CR 234 | 24 |
| CR 337 | 24 |
| MINERAL WELLS ST | 24 |
| STATE HIGHWAY 34 | 24 |
| CR 353 | 22 |
| ROCKWALL ST | 22 |
| SH 34 | 22 |
| CR 319 | 20 |
| Other | 1,063 |
2002 - 2018 National Fire Incident Reporting System (NFIRS) incidents
- Incident types reported to NFIRS in Terrell, TX
- 8,35555.9%Rescue & EMS
- 2,58717.3%Fire
- 1,56110.4%Good Intent Call
- 1,0106.8%Hazardous Condition
- 9456.3%Service Call
- 4112.7%False Alarm
- 630.4%Special Incident
- 150.1%Overpressure Rupture
- Fire incident types reported to NFIRS in Terrell, TX
- 1,37953.3%Outside Fires
- 84732.7%Structure Fires
- 27510.6%Mobile Property/Vehicle Fires
- 863.3%Other
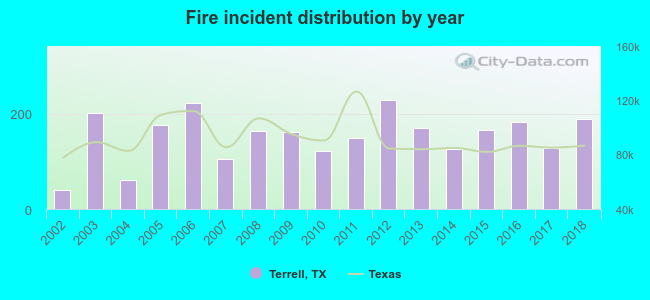 According to the data from the years 2002 - 2018 the average number of fires per year is 152. The highest number of fire incidents - 228 took place in 2012, and the least - 40 in 2002. The data has an increasing trend.
The average number of yearly fire incidents per 10k residents in Terrell, TX compared to nearest cities:
(Note: Based on data for the last 3 years, including only cities with population 5,000 and above)
| Terrell: | 100.4 |
| Kaufman: | 162.8 |
| Forney: | 71.1 |
| Heath: | 31.3 |
| Fate: | 35.2 |
| Rockwall: | 23.0 |
| Royse City: | 121.2 |
| Seagoville: | 51.3 |
| Sunnyvale: | 56.1 |
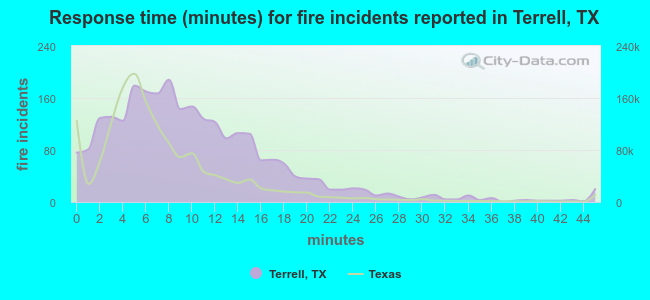 The median response time based on all reported fire incidents is 9 minutes. This is higher than the state median value.
The median response time in Terrell, TX compared to nearest cities:
(Note: Based on data for all years, including only cities with at least 500 fire incidents)
| Terrell: | 9 minutes |
| Elmo: | 11 minutes |
| Kaufman: | 10 minutes |
| Forney: | 6 minutes |
| Crandall: | 8 minutes |
| Quinlan: | 12 minutes |
| Fate: | 8 minutes |
| Wills Point: | 10 minutes |
| Scurry: | 10 minutes |
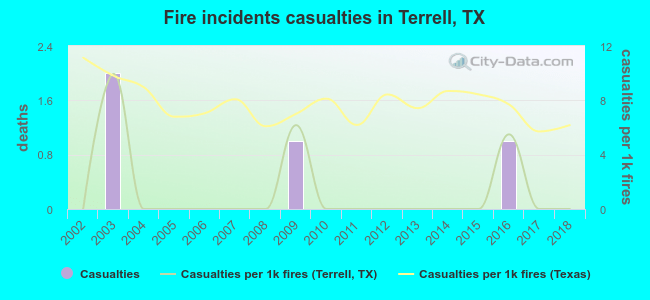 According to the reports from the years 2002 - 2018 the average number of fire-related yearly casualties is 0. The highest number of reported injuries - 2 took place in 2003, and the lowest - 0 in 2002. The data has a constant trend.
The average number of injuries per 1,000 fire incidents is 1. This indicator was the highest - 10 in 2003, and the lowest 0 in 2002. The trend for casualties per 1,000 fire incidents is constant. Compared to the state value the number of injuries per 1,000 incidents is much lower.
According to the reports from the years 2002 - 2018 the average number of fire-related yearly casualties is 0. The highest number of reported injuries - 2 took place in 2003, and the lowest - 0 in 2002. The data has a constant trend.
The average number of injuries per 1,000 fire incidents is 1. This indicator was the highest - 10 in 2003, and the lowest 0 in 2002. The trend for casualties per 1,000 fire incidents is constant. Compared to the state value the number of injuries per 1,000 incidents is much lower.
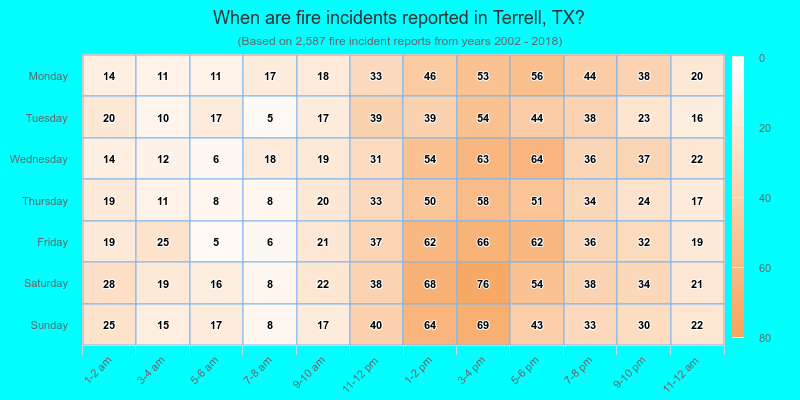
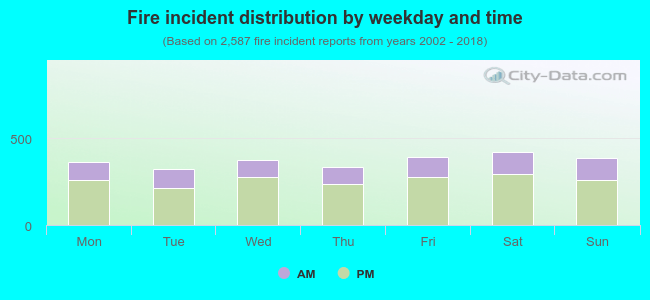 30.0% incidents where reported in the morning and 70.0% in the evening. The most fires (16.3%) took place on Saturday, and the least (12.4%) on Tuesday.
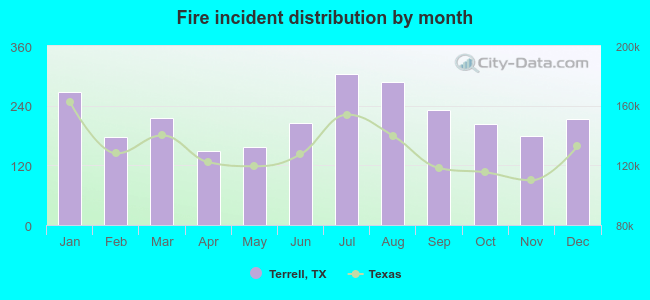 According to the 2,587 fires from years 2002 - 2018 most fires (11.7%) took place during July, and the least (5.8%) in April.
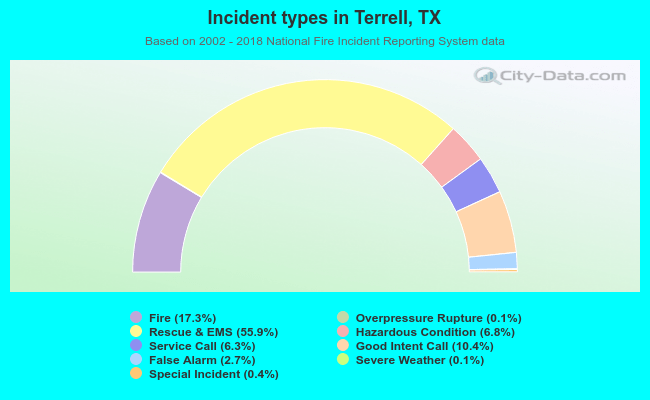 Out of all 14,958 cases reported during the years 2002 - 2018, the most belonged to the categories: Rescue & EMS (55.9%), Fire (17.3%), and Good Intent Call (10.4%).
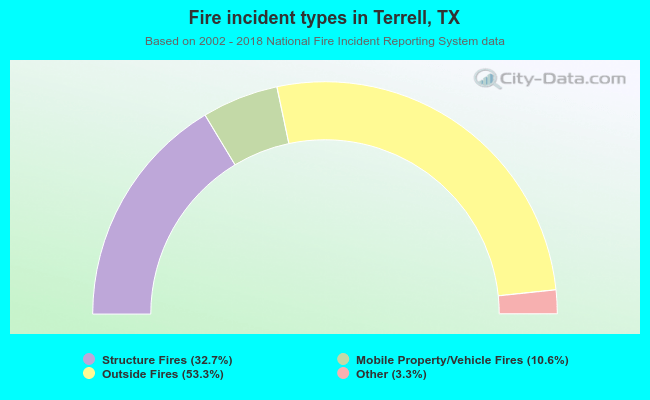 When looking into fire subcategories, the most reports belonged to: Outside Fires (53.3%), and Structure Fires (32.7%).