Texarkana: Fire Incidents, Texas (TX)
Where are fire incidents reported in Texarkana, TX
Something went wrong! Please refresh the page.
| Fire incidents reported | |
|---|---|
| Sreet name | Count |
| RICHMOND RD | 294 |
| NEW BOSTON RD | 268 |
| STATE LINE AVE | 252 |
| SUMMERHILL RD | 248 |
| COLLEGE DR | 194 |
| 7TH ST | 188 |
| LAKE DR | 160 |
| 15TH ST | 142 |
| ROBISON RD | 132 |
| ELIZABETH ST | 128 |
| NICHOLS DR | 112 |
| TEXAS BLVD | 112 |
| HAZEL ST | 96 |
| MAGNOLIA ST | 96 |
| PINE ST | 94 |
| ALLEN LN | 92 |
| BLANTON ST | 84 |
| MOORES LN | 80 |
| WALNUT ST | 80 |
| BUCHANAN RD | 78 |
| KINGS HWY | 78 |
| CONNELLA ST | 76 |
| LUMPKIN ST | 72 |
| 5TH ST | 68 |
| 9TH ST | 68 |
| KENNEDY LN | 66 |
| 13TH ST | 64 |
| ST. MICHAEL DR | 64 |
| 11TH ST | 60 |
| 17TH ST | 60 |
| Other | 2,016 |
2002 - 2018 National Fire Incident Reporting System (NFIRS) incidents
- Incident types reported to NFIRS in Texarkana, TX
- 9,50438.9%Rescue & EMS
- 5,62223.0%Fire
- 2,62010.7%Hazardous Condition
- 2,48210.2%False Alarm
- 2,1939.0%Service Call
- 1,9257.9%Good Intent Call
- 580.2%Overpressure Rupture
- Fire incident types reported to NFIRS in Texarkana, TX
- 2,39442.6%Structure Fires
- 2,25240.1%Outside Fires
- 92016.4%Mobile Property/Vehicle Fires
- 561.0%Other
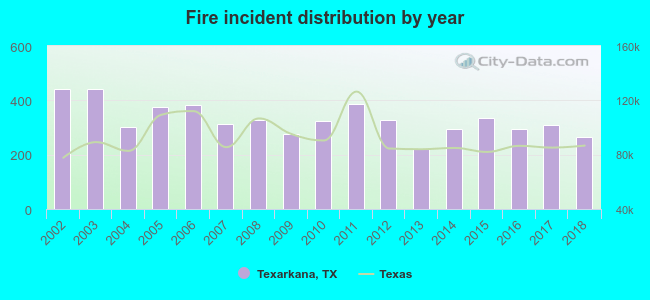 According to the data from the years 2002 - 2018 the average number of fires per year is 331. The highest number of fire incidents - 442 took place in 2002, and the least - 224 in 2013. The data has a decreasing trend.
The average number of yearly fire incidents per 10k residents in Texarkana, TX compared to nearest cities:
(Note: Based on data for the last 3 years, including only cities with population 5,000 and above)
| Texarkana: | 77.8 |
| Wake Village: | 7.3 |
| Atlanta: | 50.6 |
 The median response time based on all reported fire incidents is 5 minutes. This is lower than the state median value.
The median response time in Texarkana, TX compared to nearest cities:
(Note: Based on data for all years, including only cities with at least 500 fire incidents)
| Texarkana: | 5 minutes |
| Texarkana: | 5 minutes |
| Fouke: | 10 minutes |
| Ashdown: | 7 minutes |
| Maud: | 10 minutes |
| New Boston: | 7 minutes |
| Queen City: | 11 minutes |
| Atlanta: | 7 minutes |
| Hope: | 4 minutes |
 According to the reports from the years 2002 - 2018 the average number of fire-related yearly deaths is 1. The highest number of reported deaths - 4 took place in 2016, and the lowest - 0 in 2003. The data has a decreasing trend.
The average number of deaths per 1,000 fire incidents is 4. This indicator was the highest - 14 in 2016, and the lowest 0 in 2003. The trend for fatalities per 1,000 fire incidents is dropping. Compared to the Texas value the number of fatalities per 1,000 fire incidents is much higher.
According to the reports from the years 2002 - 2018 the average number of fire-related yearly deaths is 1. The highest number of reported deaths - 4 took place in 2016, and the lowest - 0 in 2003. The data has a decreasing trend.
The average number of deaths per 1,000 fire incidents is 4. This indicator was the highest - 14 in 2016, and the lowest 0 in 2003. The trend for fatalities per 1,000 fire incidents is dropping. Compared to the Texas value the number of fatalities per 1,000 fire incidents is much higher.Deaths per 1,000 incidents in Texarkana, TX compared to nearest cities:
(Note: Based on data for all years, including only cities with at least 2,500 fire incidents)
| Texarkana: | 3.6 |
| Texarkana: | 3.1 |
 Based on the reports from the years 2002 - 2018 the average number of fire-related casualties per year is 4. The highest number of injuries - 8 took place in 2005, and the lowest - 0 in 2014. The data has a decreasing trend.
The average number of injuries per 1,000 fire incidents is 12. This indicator was the highest - 24 in 2012, and the lowest 0 in 2014. The trend for injuries per 1,000 fires is dropping. Compared to the state value the number of casualties per 1,000 incidents is higher.
Based on the reports from the years 2002 - 2018 the average number of fire-related casualties per year is 4. The highest number of injuries - 8 took place in 2005, and the lowest - 0 in 2014. The data has a decreasing trend.
The average number of injuries per 1,000 fire incidents is 12. This indicator was the highest - 24 in 2012, and the lowest 0 in 2014. The trend for injuries per 1,000 fires is dropping. Compared to the state value the number of casualties per 1,000 incidents is higher.Casualties per 1,000 incidents in Texarkana, TX compared to nearest cities:
(Note: Based on data for all years, including only cities with at least 500 fire incidents)
| Texarkana: | 12.3 |
| Texarkana: | 20.7 |
| Fouke: | 0.0 |
| Ashdown: | 1.2 |
| Maud: | 0.0 |
| New Boston: | 3.7 |
| Queen City: | 11.5 |
| Atlanta: | 13.9 |
| Hope: | 0.5 |
 31.6% incidents where reported in the morning and 68.4% in the evening. The most fires (15.2%) took place on Monday, and the least (13.4%) on Thursday.
 According to the 5,622 fires from years 2002 - 2018 most fires (11.6%) took place during January, and the least (6.5%) in November.
 Out of all 24,440 cases reported during the years 2002 - 2018, the most belonged to the categories: Rescue & EMS (38.9%), Fire (23.0%), and Hazardous Condition (10.7%).
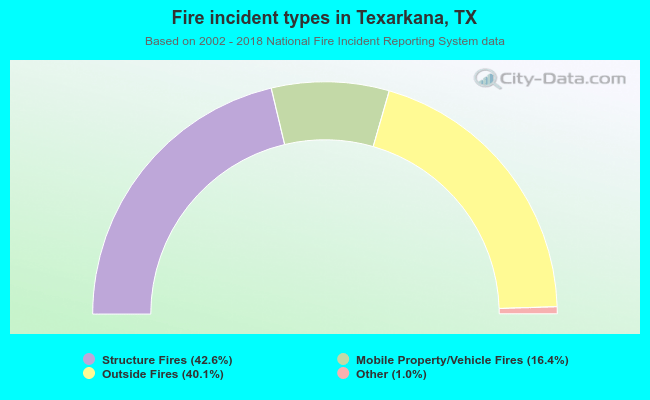 When looking into fire subcategories, the most reports belonged to: Structure Fires (42.6%), and Outside Fires (40.1%).