Texas City: Fire Incidents, Texas (TX)
Where are fire incidents reported in Texas City, TX
Something went wrong! Please refresh the page.
| Fire incidents reported | |
|---|---|
| Sreet name | Count |
| EMMETT F LOWRY EXPY | 272 |
| HWY 146 | 176 |
| PALMER HWY | 164 |
| IH 45 | 150 |
| 5TH AV | 144 |
| 9TH AV | 108 |
| DIKE RD | 106 |
| LOOP 197 HWY | 82 |
| FM 1765 | 68 |
| 13TH AV | 56 |
| BAY ST | 56 |
| 3RD AV | 54 |
| 21ST ST | 52 |
| 5TH AVE | 52 |
| HWY 3 | 48 |
| 2ND AV | 46 |
| 7TH AV | 46 |
| 25TH ST | 44 |
| 5TH | 42 |
| 6TH AV | 42 |
| TEXAS AV | 42 |
| 19TH AV | 38 |
| 1ST AV | 38 |
| LEVEE RD | 38 |
| 34TH ST | 36 |
| 6TH ST | 34 |
| 8TH AV | 34 |
| TEXAS CITY PORT BLVD | 34 |
| AMBURN RD | 32 |
| HUMBLE CAMP RD | 32 |
| Other | 465 |
2004 - 2018 National Fire Incident Reporting System (NFIRS) incidents
- Incident types reported to NFIRS in Texas City, TX
- 22,72867.6%Rescue & EMS
- 2,6317.8%Fire
- 2,5817.7%Hazardous Condition
- 2,4157.2%Service Call
- 1,9555.8%Good Intent Call
- 1,2363.7%False Alarm
- Fire incident types reported to NFIRS in Texas City, TX
- 1,18345.0%Outside Fires
- 83331.7%Structure Fires
- 47117.9%Mobile Property/Vehicle Fires
- 1445.5%Other
 Based on the data from the years 2004 - 2018 the average number of fires per year is 175. The highest number of fires - 227 took place in 2011, and the least - 117 in 2004. The data has an increasing trend.
The average number of yearly fire incidents per 10k residents in Texas City, TX compared to nearest cities:
(Note: Based on data for the last 3 years, including only cities with population 5,000 and above)
| Texas City: | 44.2 |
| La Marque: | 41.9 |
| Hitchcock: | 44.3 |
| Bacliff: | 40.6 |
| Dickinson: | 40.8 |
| Santa Fe: | 71.3 |
| Galveston: | 54.6 |
| League City: | 15.7 |
| Seabrook: | 13.6 |
 The median response time based on all reported fire incidents is 6 minutes. This is similar to the Texas median value.
The median response time in Texas City, TX compared to nearest cities:
(Note: Based on data for all years, including only cities with at least 500 fire incidents)
| Texas City: | 6 minutes |
| La Marque: | 5 minutes |
| Hitchcock: | 8 minutes |
| Dickinson: | 6 minutes |
| Santa Fe: | 7 minutes |
| Galveston: | 4 minutes |
| League City: | 7 minutes |
| Seabrook: | 8 minutes |
| Webster: | 5 minutes |
 According to the reports from the years 2004 - 2018 the average number of fire-related yearly deaths is 1. The highest number of deaths - 2 took place in 2008, and the lowest - 0 in 2004. The data has a rising trend.
The average number of deaths per 1,000 fire incidents is 4. This indicator was the highest - 13 in 2012, and the lowest 0 in 2004. The trend for fatalities per 1,000 fire incidents is growing. Compared to the state value the number of fatalities per 1,000 incidents is much higher.
According to the reports from the years 2004 - 2018 the average number of fire-related yearly deaths is 1. The highest number of deaths - 2 took place in 2008, and the lowest - 0 in 2004. The data has a rising trend.
The average number of deaths per 1,000 fire incidents is 4. This indicator was the highest - 13 in 2012, and the lowest 0 in 2004. The trend for fatalities per 1,000 fire incidents is growing. Compared to the state value the number of fatalities per 1,000 incidents is much higher.
 Based on the data from the years 2004 - 2018 the average number of fire-related casualties per year is 1. The highest number of reported injuries - 3 took place in 2004, and the lowest - 0 in 2007. The data has a declining trend.
The average number of casualties per 1,000 fire incidents is 5. This indicator was the highest - 26 in 2004, and the lowest 0 in 2007. The trend for casualties per 1,000 incidents is decreasing. Compared to the Texas value the number of casualties per 1,000 fires is lower.
Based on the data from the years 2004 - 2018 the average number of fire-related casualties per year is 1. The highest number of reported injuries - 3 took place in 2004, and the lowest - 0 in 2007. The data has a declining trend.
The average number of casualties per 1,000 fire incidents is 5. This indicator was the highest - 26 in 2004, and the lowest 0 in 2007. The trend for casualties per 1,000 incidents is decreasing. Compared to the Texas value the number of casualties per 1,000 fires is lower.
 31.4% incidents where reported in the morning and 68.6% in the evening. The most fires (15.3%) took place on Sunday, and the least (13.0%) on Wednesday.
 Based on the 2,631 fire incident reports from years 2004 - 2018 most fires (9.5%) took place during May, and the least (7.0%) in February.
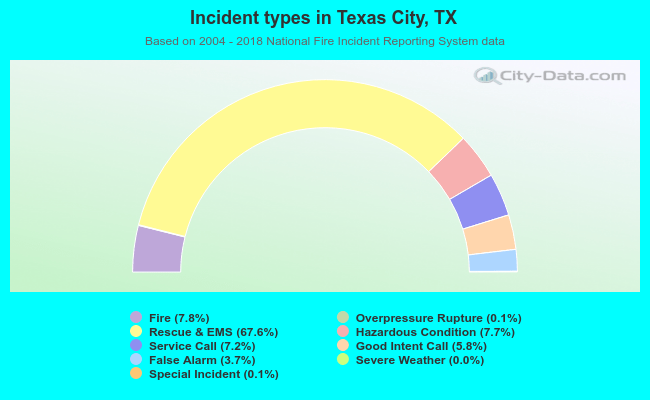 Out of all 33,601 cases reported during the years 2004 - 2018, the most belonged to the categories: Rescue & EMS (67.6%), Fire (7.8%), and Hazardous Condition (7.7%).
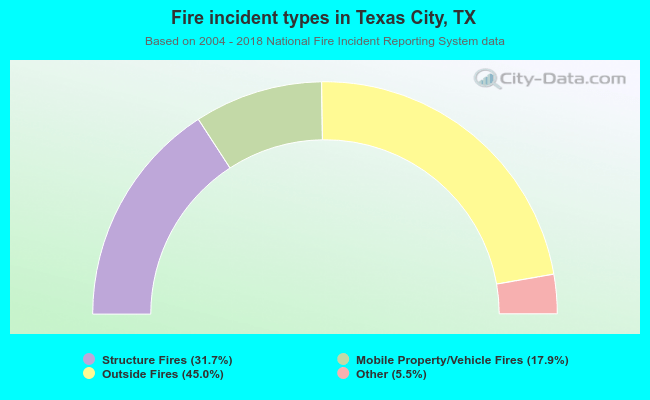 When looking into fire subcategories, the most incidents belonged to: Outside Fires (45.0%), and Structure Fires (31.7%).