The Woodlands: Fire Incidents, Texas (TX)
Where are fire incidents reported in The Woodlands, TX
Something went wrong! Please refresh the page.
| Fire incidents reported | |
|---|---|
| Sreet name | Count |
| PANTHER CREEK DR | 212 |
| LAKE WOODLANDS DR | 136 |
| SAWMILL RD | 96 |
| ALDEN BRIDGE DR | 82 |
| LAKE ROBBINS DR | 82 |
| RESEARCH FOREST DRIVE | 76 |
| MILLBEND DR | 74 |
| RESEARCH FOREST DR | 72 |
| COLLEGE PARK DR | 62 |
| TANGLEBRUSH DR | 62 |
| PANTHER CREEK DRIVE | 52 |
| HOLLY CREEK CT | 46 |
| SIX PINES DR | 44 |
| RESEARCH FRST DR | 42 |
| SIX PINES RD | 42 |
| WINDVALE CIR | 42 |
| SAWDUST RD | 40 |
| WOODLANDS PKWAY | 38 |
| BRANCH CROSSING DR | 36 |
| RED CEDAR CIR | 36 |
| SIX PINES DR | 30 |
| WOODLANDS PARKWAY | 30 |
| HIGH OAKS CIR | 28 |
| SIX PINES RD | 28 |
| COCHRANS CROSSING DR | 26 |
| CAPSTONE CIR | 22 |
| GLEN LOCH DR | 22 |
| GROGAN'S MILL RD | 22 |
| GROGAN'S MILL RD | 22 |
| WATERWAY AVE | 22 |
| Other | 1,077 |
2002 - 2018 National Fire Incident Reporting System (NFIRS) incidents
- Incident types reported to NFIRS in The Woodlands, TX
- 24,61957.2%Rescue & EMS
- 7,25216.8%Good Intent Call
- 4,48210.4%False Alarm
- 2,7016.3%Fire
- 2,5355.9%Hazardous Condition
- 1,2843.0%Service Call
- 840.2%Overpressure Rupture
- 720.2%Severe Weather
- Fire incident types reported to NFIRS in The Woodlands, TX
- 1,14542.4%Outside Fires
- 1,00337.1%Structure Fires
- 37113.7%Mobile Property/Vehicle Fires
- 1826.7%Other
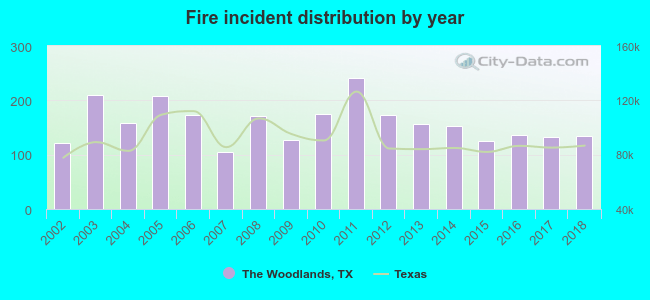 Based on the data from the years 2002 - 2018 the average number of fires per year is 159. The highest number of fires - 241 took place in 2011, and the least - 104 in 2007. The data has an increasing trend.
The average number of yearly fire incidents per 10k residents in The Woodlands, TX compared to nearest cities:
(Note: Based on data for the last 3 years, including only cities with population 5,000 and above)
| The Woodlands: | 14.3 |
| Tomball: | 209.2 |
| Conroe: | 106.3 |
| Spring: | 113.9 |
| Willis: | 247.0 |
| Humble: | 217.5 |
| Aldine: | 1.6 |
| Jersey Village: | 29.9 |
| Atascocita: | 1.4 |
 The median response time based on all reported fire incidents is 6 minutes. This is similar to the Texas median value.
The median response time in The Woodlands, TX compared to nearest cities:
(Note: Based on data for all years, including only cities with at least 500 fire incidents)
| The Woodlands: | 6 minutes |
| Tomball: | 8 minutes |
| Conroe: | 7 minutes |
| Spring: | 7 minutes |
| Magnolia: | 9 minutes |
| Willis: | 9 minutes |
| Montgomery: | 8 minutes |
| Humble: | 7 minutes |
| Splendora: | 10 minutes |
 According to the reports from the years 2002 - 2018 the average number of fire-related yearly deaths is 0. The highest number of deaths - 1 took place in 2005, and the lowest - 0 in 2002. The data has a constant trend.
The average number of fatalities per 1,000 fires is 1. This indicator was the highest - 6 in 2008, and the lowest 0 in 2002. The trend for fatalities per 1,000 fires is constant. Compared to the state value the number of fatalities per 1,000 fire incidents is lower.
According to the reports from the years 2002 - 2018 the average number of fire-related yearly deaths is 0. The highest number of deaths - 1 took place in 2005, and the lowest - 0 in 2002. The data has a constant trend.
The average number of fatalities per 1,000 fires is 1. This indicator was the highest - 6 in 2008, and the lowest 0 in 2002. The trend for fatalities per 1,000 fires is constant. Compared to the state value the number of fatalities per 1,000 fire incidents is lower.
 According to the reports from the years 2002 - 2018 the average number of fire-related casualties per year is 3. The highest number of reported injuries - 7 took place in 2003, and the lowest - 0 in 2007. The data has an increasing trend.
The average number of casualties per 1,000 fire incidents is 19. This indicator was the highest - 39 in 2009, and the lowest 0 in 2007. The trend for casualties per 1,000 incidents is increasing. Compared to the Texas value the number of injuries per 1,000 fires is much higher.
According to the reports from the years 2002 - 2018 the average number of fire-related casualties per year is 3. The highest number of reported injuries - 7 took place in 2003, and the lowest - 0 in 2007. The data has an increasing trend.
The average number of casualties per 1,000 fire incidents is 19. This indicator was the highest - 39 in 2009, and the lowest 0 in 2007. The trend for casualties per 1,000 incidents is increasing. Compared to the Texas value the number of injuries per 1,000 fires is much higher.
 30.2% incidents where reported in the morning and 69.8% in the evening. The most fires (15.5%) took place on Monday, and the least (13.1%) on Thursday.
 According to the 2,701 fires from years 2002 - 2018 most fires (11.0%) took place during July, and the least (6.7%) in September.
 Out of all 43,044 cases reported during the years 2002 - 2018, the most belonged to the categories: Rescue & EMS (57.2%), Good Intent Call (16.8%), and False Alarm (10.4%).
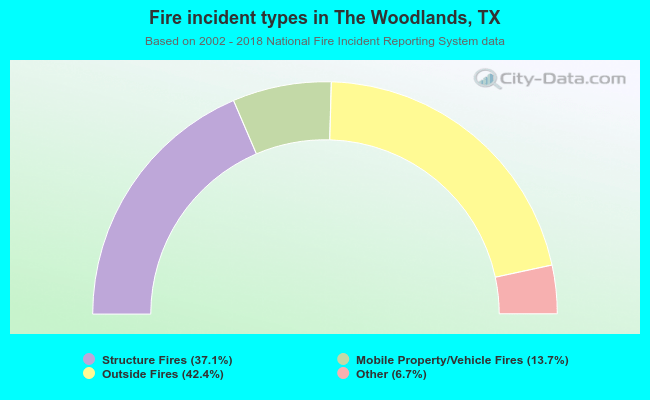 When looking into fire subcategories, the most incidents belonged to: Outside Fires (42.4%), and Structure Fires (37.1%).