Thousand Oaks: Fire Incidents, California (CA)
Where are fire incidents reported in Thousand Oaks, CA
Something went wrong! Please refresh the page.
| Fire incidents reported | |
|---|---|
| Sreet name | Count |
| HILLCREST DR | 124 |
| MOORPARK RD | 114 |
| AVENIDA DE LOS ARBOLES | 74 |
| THOUSAND OAKS BLVD | 70 |
| JANSS RD | 64 |
| SB 101 NO | 56 |
| HILLCREST | 52 |
| ERBES RD | 46 |
| AVENIDA DE LAS FLORES | 44 |
| MOORPARK | 40 |
| SB 101 AT | 40 |
| THOUSAND OAKS | 40 |
| VENTU PARK RD | 34 |
| NEWBURY RD | 32 |
| OLSEN RD | 30 |
| 101 FRWY | 28 |
| GAINSBOROUGH RD | 28 |
| NB 101 AT | 24 |
| NB 101 SO | 22 |
| SB 23 AT | 22 |
| VENTU PARK | 22 |
| LAWRENCE DR | 20 |
| LYNN | 20 |
| RANCHO RD | 20 |
| SB 23 NO | 20 |
| WILBUR RD | 20 |
| LYNN RD | 18 |
| NB 23 AT | 18 |
| SB 101 SO | 18 |
| THOUSAND OAKS BL | 18 |
| Other | 462 |
2005 - 2018 National Fire Incident Reporting System (NFIRS) incidents
- Incident types reported to NFIRS in Thousand Oaks, CA
- 24,19067.3%Rescue & EMS
- 4,74713.2%Good Intent Call
- 2,8267.9%Service Call
- 1,6404.6%Fire
- 1,3133.7%Hazardous Condition
- 1,0963.0%False Alarm
- 480.1%Overpressure Rupture
- 450.1%Severe Weather
- 370.1%Special Incident
- Fire incident types reported to NFIRS in Thousand Oaks, CA
- 60036.6%Outside Fires
- 41625.4%Structure Fires
- 33420.4%Mobile Property/Vehicle Fires
- 29017.7%Other
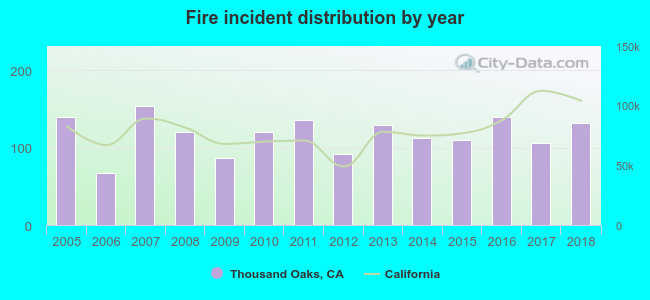 Based on the data from the years 2005 - 2018 the average number of fires per year is 117. The highest number of reported fires - 154 took place in 2007, and the least - 67 in 2006. The data has a decreasing trend.
The average number of yearly fire incidents per 10k residents in Thousand Oaks, CA compared to nearest cities:
(Note: Based on data for the last 3 years, including only cities with population 5,000 and above)
| Thousand Oaks: | 9.7 |
| Westlake Village: | 9.0 |
| Moorpark: | 13.3 |
| Oak Park: | 6.8 |
| Agoura Hills: | 13.3 |
| Camarillo: | 17.4 |
| Simi Valley: | 13.7 |
| Malibu: | 37.6 |
| Calabasas: | 15.5 |
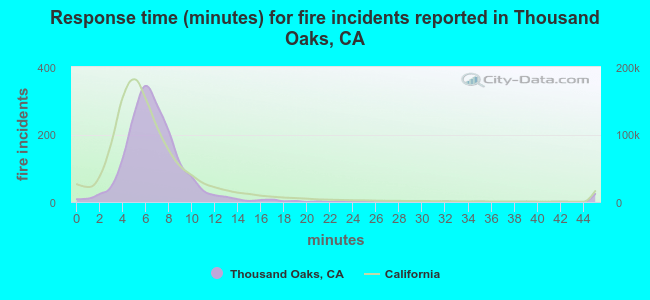 The median response time based on all reported fire incidents is 6 minutes. This is similar to the California median value.
The median response time in Thousand Oaks, CA compared to nearest cities:
(Note: Based on data for all years, including only cities with at least 500 fire incidents)
| Thousand Oaks: | 6 minutes |
| Moorpark: | 7 minutes |
| Camarillo: | 6 minutes |
| Simi Valley: | 6 minutes |
| Malibu: | 6 minutes |
| Santa Paula: | 6 minutes |
| Oxnard: | 5 minutes |
| Port Hueneme: | 6 minutes |
| Ventura: | 7 minutes |
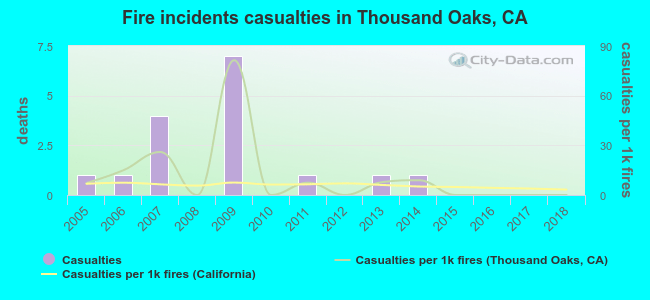 Based on the reports from the years 2005 - 2018 the average number of fire-related yearly casualties is 1. The highest number of reported casualties - 7 took place in 2009, and the lowest - 0 in 2008. The data has a dropping trend.
The average number of casualties per 1,000 fires is 11. This indicator was the highest - 81 in 2009, and the lowest 0 in 2008. The trend for injuries per 1,000 incidents is decreasing. Compared to the California value the number of casualties per 1,000 incidents is higher.
Based on the reports from the years 2005 - 2018 the average number of fire-related yearly casualties is 1. The highest number of reported casualties - 7 took place in 2009, and the lowest - 0 in 2008. The data has a dropping trend.
The average number of casualties per 1,000 fires is 11. This indicator was the highest - 81 in 2009, and the lowest 0 in 2008. The trend for injuries per 1,000 incidents is decreasing. Compared to the California value the number of casualties per 1,000 incidents is higher.Casualties per 1,000 incidents in Thousand Oaks, CA compared to nearest cities:
(Note: Based on data for all years, including only cities with at least 500 fire incidents)
| Thousand Oaks: | 9.8 |
| Moorpark: | 2.9 |
| Camarillo: | 4.1 |
| Simi Valley: | 7.5 |
| Malibu: | 0.0 |
| Santa Paula: | 6.3 |
| Oxnard: | 5.6 |
| Port Hueneme: | 6.6 |
| Ventura: | 6.0 |
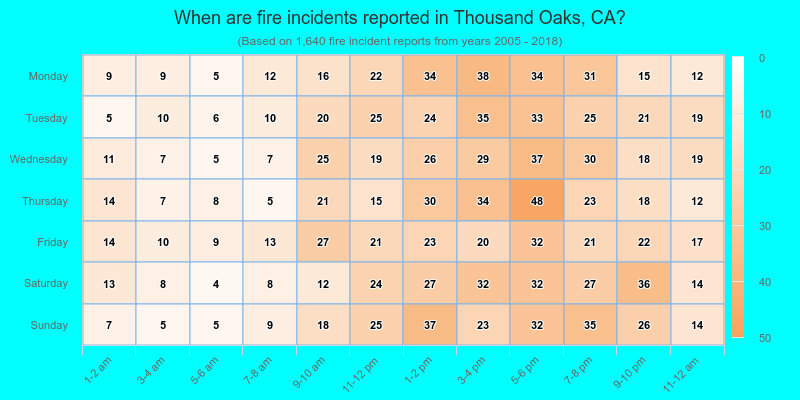
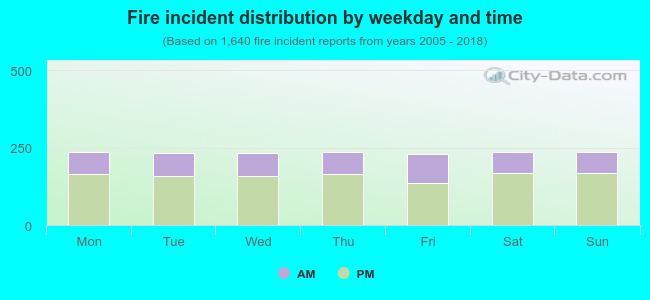 32.0% incidents where reported in the morning and 68.0% in the evening. The most fires (14.5%) took place on Monday, and the least (14.0%) on Friday.
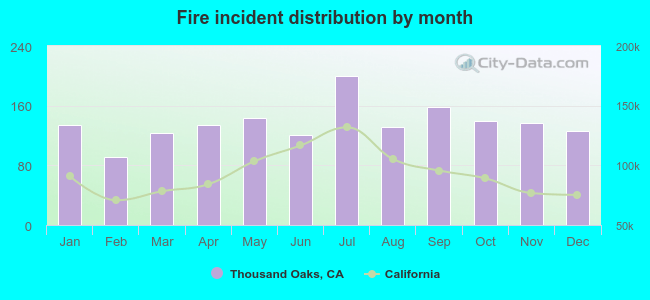 According to the 1,640 fires from years 2005 - 2018 most fires (12.2%) took place during July, and the least (5.5%) in February.
 Out of all 35,942 cases reported during the years 2005 - 2018, the most belonged to the categories: Rescue & EMS (67.3%), Good Intent Call (13.2%), and Service Call (7.9%).
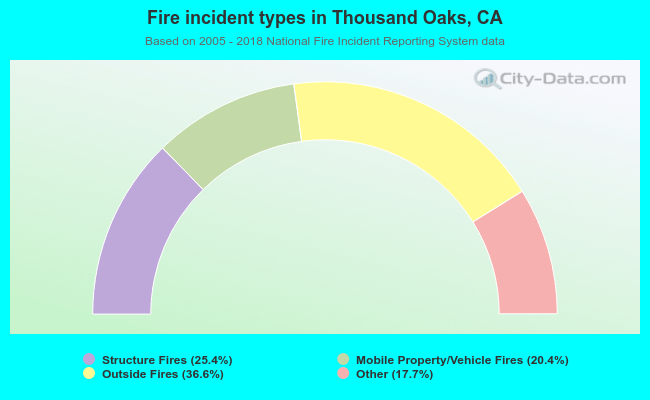 When looking into fire subcategories, the most reports belonged to: Outside Fires (36.6%), and Structure Fires (25.4%).