| Fire incidents reported |
|---|
| Sreet name | Count |
|---|
| 169 | 36 | | PINE ISLAND | 16 | | FARM ROAD | 12 | | BIRCH POINT ROAD | 10 | | BOIS FORTE ROAD | 8 | | EAGLE POINT RD | 8 | | HWY 169 | 8 | | TARKMAN RD | 8 | | BOISE FORTE RD | 6 | | ECHO PT RD | 6 | | FARM RD | 6 | | OLD CEMETERY RD | 6 | | STATE HIGHWAY 1 | 6 | | STATE HWY 169 | 6 | | 169 HWY | 4 | | 3RD ST | 4 | | BIRCH POINT RD | 4 | | BOIS FORTE RD | 4 | | BREEZY POINT RD | 4 | | COUNTY ROAD # 77 | 4 | | DAISY ISLAND | 4 | | DUFFY PT RD | 4 | | EVERETT BAY RD | 4 | | FARM RD | 4 | | FORTUNE BAY | 4 |
| | | Fire incidents reported |
|---|
| Sreet name | Count |
|---|
| HIGHWAY 169 | 4 | | HWY 135 HWY | 4 | | HWY 169 HWY | 4 | | NORWAY ROAD | 4 | | OLD HWY 77 | 4 | | OWLAND ISLAND | 4 | | PINE ST | 4 | | RED PINE COURT | 4 | | ST ODILIA BEACH RD | 4 | | STATE HIGHWAY 169 | 4 | | VELKOMMEN BEACH RD | 4 | | WAHLSTEN RD | 4 | | HWY | 2 | | 1041 MANITOU PARK DRS | 2 | | 135 HWY | 2 | | 1430 BOIS FORTE RD | 2 | | 1430 BOIS FORTE ROAD | 2 | | 1430 BOISE FORTE RD | 2 | | 2ND ST | 2 | | 2ND STREET NORTH | 2 | | 2ND STREET ST | 2 | | 3RD ST | 2 | | 3RD ST N | 2 | | 3RD STREET NORTH | 2 | | |
|
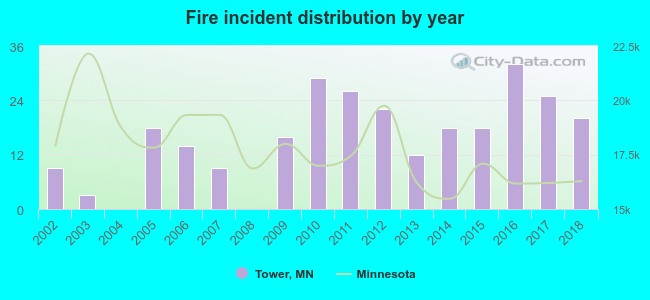 Based on the data from the years 2002 - 2018 the average number of fires per year is 16. The highest number of fires - 32 took place in 2016, and the least - 0 in 2004. The data has a rising trend.
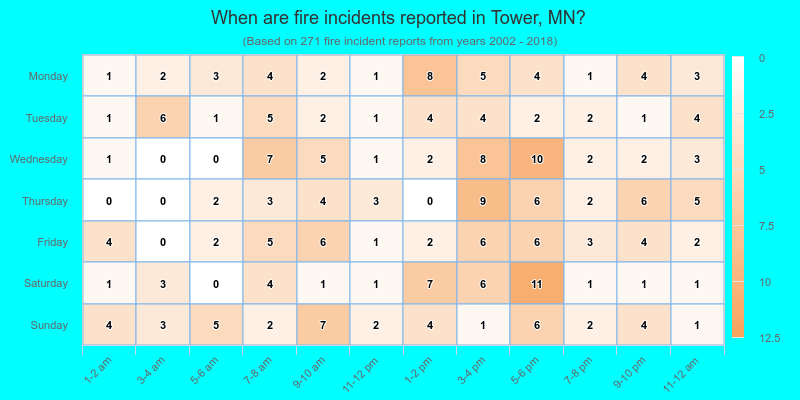
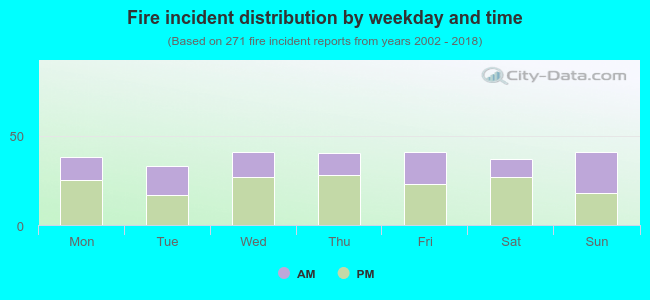 39.1% incidents where reported in the morning and 60.9% in the evening. The most fires (15.1%) took place on Wednesday, and the least (12.2%) on Tuesday.
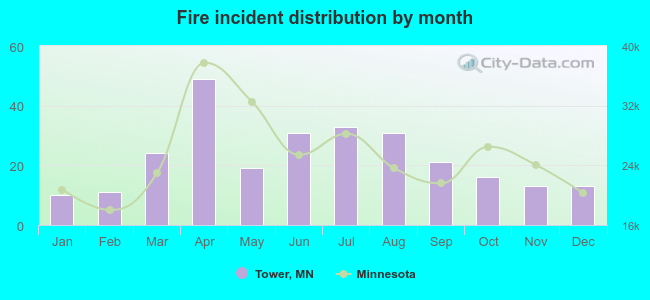 Based on the 271 fire incidents from years 2002 - 2018 most fires (18.1%) took place during April, and the least (3.7%) in January.
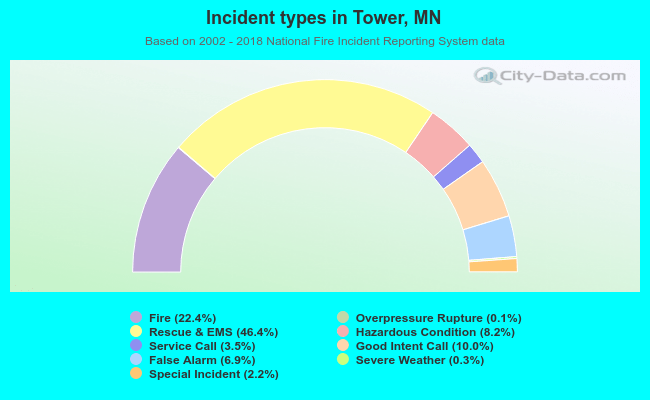 Out of all 1,210 cases reported during the years 2002 - 2018, the most belonged to the categories: Rescue & EMS (46.4%), Fire (22.4%), and Good Intent Call (10.0%).
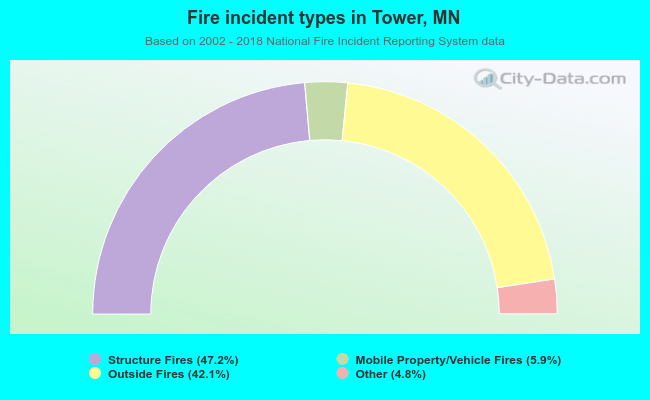 When looking into fire subcategories, the most incidents belonged to: Structure Fires (47.2%), and Outside Fires (42.1%).