Twentynine Palms: Fire Incidents, California (CA)
Where are fire incidents reported in Twentynine Palms, CA
Something went wrong! Please refresh the page.
|
| |||||||||||||||||||||||||||||||||||||||||||||||||||||||||||||||||||||||||||||||||||||||||||||||||||||||||||||
2006 - 2018 National Fire Incident Reporting System (NFIRS) incidents
- Incident types reported to NFIRS in Twentynine Palms, CA
- 22627.4%Rescue & EMS
- 18121.9%Service Call
- 17120.7%Fire
- 14617.7%Good Intent Call
- 9511.5%Hazardous Condition
- 50.6%False Alarm
- 20.2%Special Incident
- Fire incident types reported to NFIRS in Twentynine Palms, CA
- 6437.4%Outside Fires
- 5833.9%Structure Fires
- 4425.7%Mobile Property/Vehicle Fires
- 52.9%Other
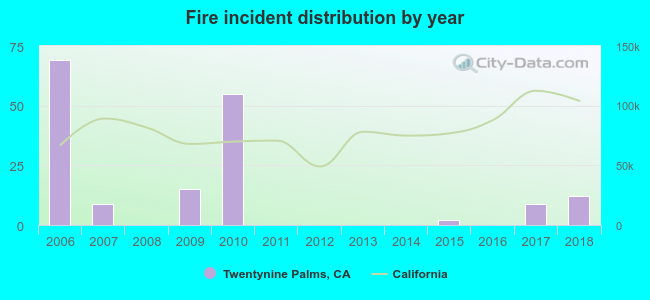 Based on the data from the years 2006 - 2018 the average number of fires per year is 13. The highest number of fire incidents - 69 took place in 2006, and the least - 0 in 2008. The data has a declining trend.
The average number of yearly fire incidents per 10k residents in Twentynine Palms, CA compared to nearest cities:
(Note: Based on data for the last 3 years, including only cities with population 5,000 and above)
| Twentynine Palms: | 4.1 |
| Joshua Tree: | 47.2 |
| Yucca Valley: | 14.1 |
| Desert Hot Springs: | 1.2 |
| Bermuda Dunes: | 1.4 |
| Indio: | 1.2 |
| Cathedral City: | 30.9 |
| Coachella: | 0.6 |
| Rancho Mirage: | 1.1 |

 25.7% incidents where reported in the morning and 74.3% in the evening. The most fires (15.8%) took place on Sunday, and the least (11.7%) on Monday.
 Based on the 171 incident reports from years 2006 - 2018 most fires (12.3%) took place during March, and the least (5.3%) in April.
 Out of all 826 cases reported during the years 2006 - 2018, the most belonged to the categories: Overpressure Rupture (27.4%), Hazardous Condition (21.9%), and Fire (20.7%).
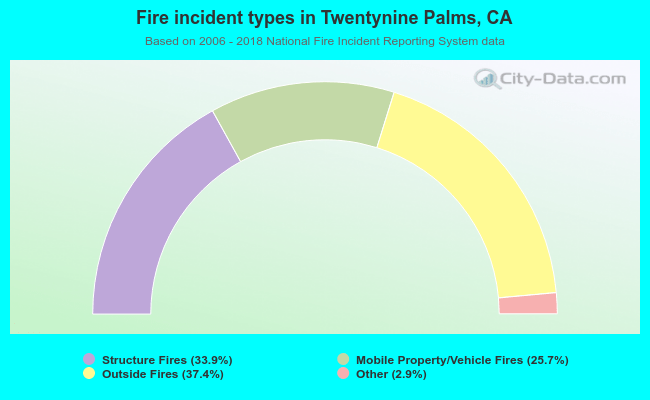 When looking into fire subcategories, the most reports belonged to: Outside Fires (37.4%), and Structure Fires (33.9%).