Upper Arlington: Fire Incidents, Ohio (OH)
Where are fire incidents reported in Upper Arlington, OH
Something went wrong! Please refresh the page.
| Fire incidents reported | |
|---|---|
| Sreet name | Count |
| RIVERSIDE DR | 130 |
| LANE AVE | 70 |
| FISHINGER RD | 64 |
| TREMONT RD | 50 |
| HENDERSON RD | 48 |
| CAMBRIDGE BLVD | 42 |
| REED RD | 42 |
| BRANDON RD | 36 |
| NORTHWEST BLVD | 32 |
| DIERKER RD | 26 |
| MCCOY RD | 24 |
| ARLINGTON AVE | 20 |
| NORTHSTAR RD | 20 |
| ZOLLINGER RD | 20 |
| MOUNTVIEW RD | 18 |
| COVENTRY RD | 16 |
| KIOKA AVE | 16 |
| RIDGEVIEW RD | 16 |
| SHREWSBURY RD | 16 |
| WALTHAM RD | 16 |
| WOODSTOCK RD | 14 |
| CANTERBURY RD | 12 |
| DORSET RD | 12 |
| GUILFORD RD | 12 |
| JOHNSTON RD | 12 |
| KENNY RD | 12 |
| MACKENZIE DR | 12 |
| MOUNT HOLYOKE RD | 12 |
| NORTHAM RD | 12 |
| NORTHWEST PROFESSIONAL PL | 12 |
| Other | 178 |
2002 - 2018 National Fire Incident Reporting System (NFIRS) incidents
- Incident types reported to NFIRS in Upper Arlington, OH
- 11,90352.8%Rescue & EMS
- 3,31514.7%Good Intent Call
- 2,51811.2%Hazardous Condition
- 1,8338.1%False Alarm
- 1,7647.8%Service Call
- 1,0224.5%Fire
- 1470.7%Special Incident
- 360.2%Severe Weather
- 240.1%Overpressure Rupture
- Fire incident types reported to NFIRS in Upper Arlington, OH
- 61760.4%Structure Fires
- 27226.6%Outside Fires
- 918.9%Mobile Property/Vehicle Fires
- 424.1%Other
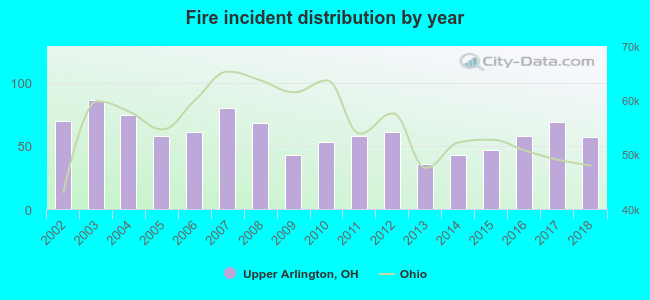 According to the data from the years 2002 - 2018 the average number of fires per year is 60. The highest number of reported fires - 86 took place in 2003, and the least - 36 in 2013. The data has a dropping trend.
The average number of yearly fire incidents per 10k residents in Upper Arlington, OH compared to nearest cities:
(Note: Based on data for the last 3 years, including only cities with population 5,000 and above)
| Upper Arlington: | 17.7 |
| Grandview Heights: | 16.1 |
| Hilliard: | 26.7 |
| Columbus: | 38.2 |
| Worthington: | 24.6 |
| Dublin: | 22.9 |
| Bexley: | 9.6 |
| Powell: | 33.0 |
| Grove City: | 17.6 |
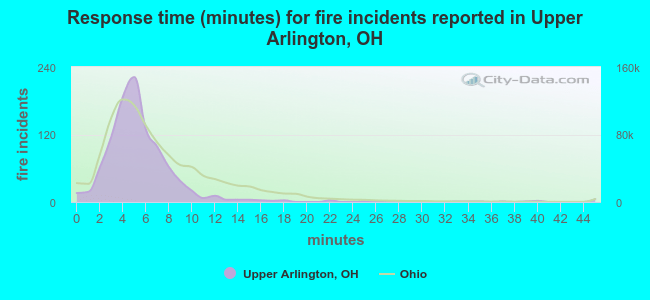 The median response time based on all reported fire incidents is 5 minutes. This is lower compared to the Ohio median value.
The median response time in Upper Arlington, OH compared to nearest cities:
(Note: Based on data for all years, including only cities with at least 500 fire incidents)
| Upper Arlington: | 5 minutes |
| Hilliard: | 6 minutes |
| Columbus: | 4 minutes |
| Worthington: | 4 minutes |
| Dublin: | 5 minutes |
| Powell: | 6 minutes |
| Grove City: | 5 minutes |
| Gahanna: | 5 minutes |
| Westerville: | 6 minutes |
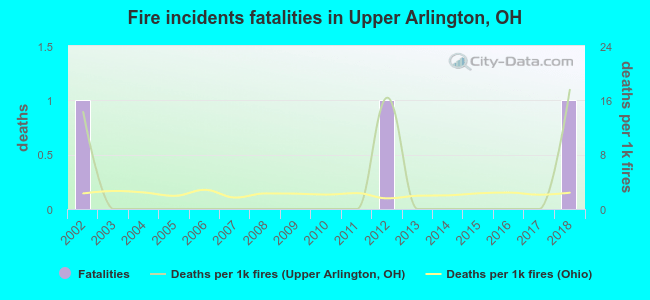 Based on the reports from the years 2002 - 2018 the average number of fire-related yearly deaths is 0. The highest number of deaths - 1 took place in 2002, and the lowest - 0 in 2003. The data has a constant trend.
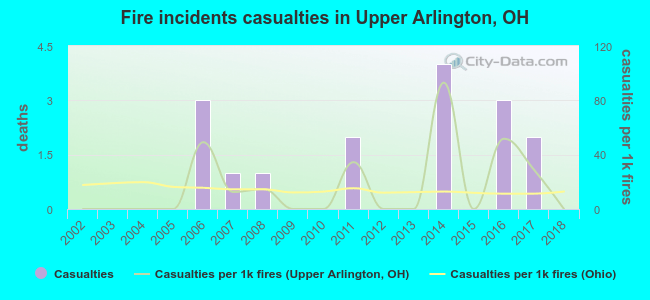 Based on the data from the years 2002 - 2018 the average number of fire-related yearly casualties is 1. The highest number of injuries - 4 took place in 2014, and the lowest - 0 in 2002. The data has a constant trend.
The average number of injuries per 1,000 fires is 17. This indicator was the highest - 93 in 2014, and the lowest 0 in 2002. The trend for casualties per 1,000 fire incidents is constant. Compared to the Ohio value the number of casualties per 1,000 fires is about the same.
Based on the data from the years 2002 - 2018 the average number of fire-related yearly casualties is 1. The highest number of injuries - 4 took place in 2014, and the lowest - 0 in 2002. The data has a constant trend.
The average number of injuries per 1,000 fires is 17. This indicator was the highest - 93 in 2014, and the lowest 0 in 2002. The trend for casualties per 1,000 fire incidents is constant. Compared to the Ohio value the number of casualties per 1,000 fires is about the same.Casualties per 1,000 incidents in Upper Arlington, OH compared to nearest cities:
(Note: Based on data for all years, including only cities with at least 500 fire incidents)
| Upper Arlington: | 15.7 |
| Hilliard: | 12.7 |
| Columbus: | 13.4 |
| Worthington: | 10.2 |
| Dublin: | 2.4 |
| Powell: | 11.1 |
| Grove City: | 14.1 |
| Gahanna: | 7.5 |
| Westerville: | 15.6 |
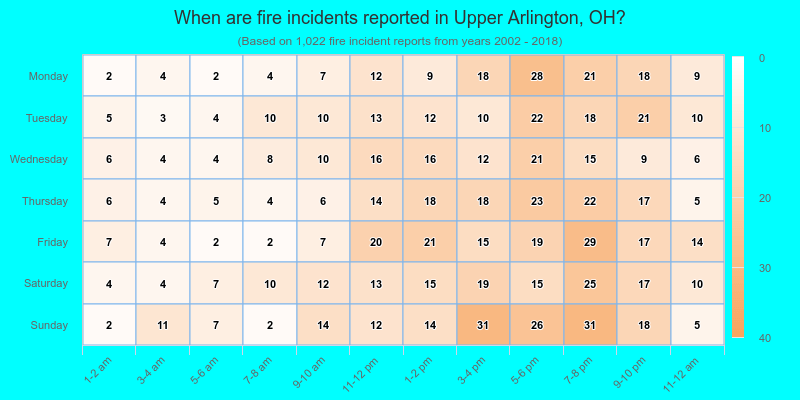
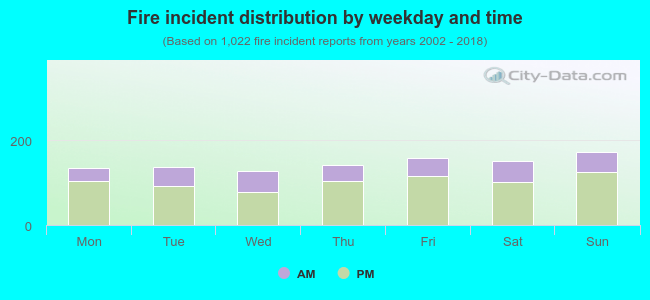 29.6% incidents where reported in the morning and 70.4% in the evening. The most fires (16.9%) took place on Sunday, and the least (12.4%) on Wednesday.
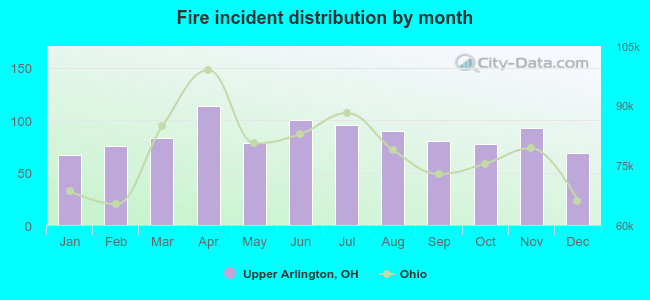 According to the 1,022 fire incidents from years 2002 - 2018 most fires (11.2%) took place during April, and the least (6.6%) in January.
 Out of all 22,562 cases reported during the years 2002 - 2018, the most belonged to the categories: Rescue & EMS (52.8%), Good Intent Call (14.7%), and Hazardous Condition (11.2%).
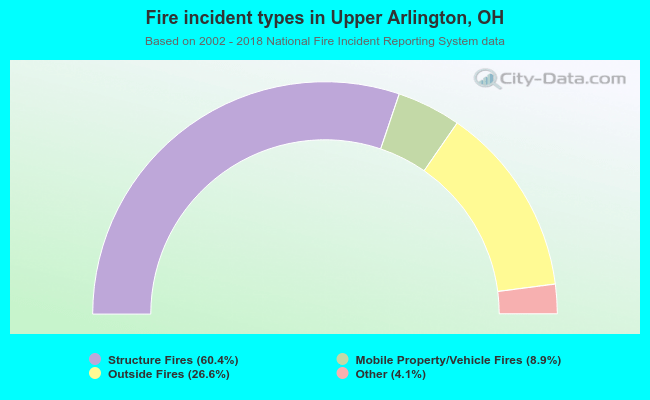 When looking into fire subcategories, the most incidents belonged to: Structure Fires (60.4%), and Outside Fires (26.6%).