Villa Hills: Fire Incidents, Kentucky (KY)
Where are fire incidents reported in Villa Hills, KY
Something went wrong! Please refresh the page.
|
| |||||||||||||||||||||||||||||||||||||||||||||||||||||||||||||||||||||||||||||||||||||||||||||||||||||||||||||
2002 - 2018 National Fire Incident Reporting System (NFIRS) incidents
- Incident types reported to NFIRS in Villa Hills, KY
- 42837.3%Rescue & EMS
- 17014.8%Hazardous Condition
- 16714.6%Fire
- 15113.2%False Alarm
- 1119.7%Good Intent Call
- 1079.3%Service Call
- 100.9%Severe Weather
- Fire incident types reported to NFIRS in Villa Hills, KY
- 8148.5%Structure Fires
- 5633.5%Outside Fires
- 2213.2%Mobile Property/Vehicle Fires
- 84.8%Other
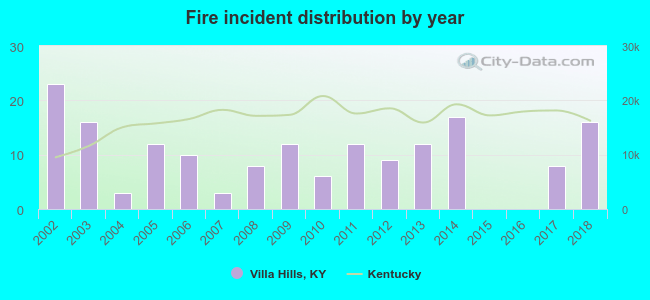 Based on the data from the years 2002 - 2018 the average number of fire incidents per year is 10. The highest number of reported fires - 23 took place in 2002, and the least - 0 in 2015. The data has a declining trend.
The average number of yearly fire incidents per 10k residents in Villa Hills, KY compared to nearest cities:
(Note: Based on data for the last 3 years, including only cities with population 5,000 and above)
| Villa Hills: | 16.2 |
| Fort Mitchell: | 26.6 |
| Fort Wright: | 20.3 |
| Erlanger: | 44.2 |
| Edgewood: | 17.9 |
| Elsmere: | 33.3 |
| Covington: | 49.4 |
| Florence: | 68.6 |
| Newport: | 44.7 |
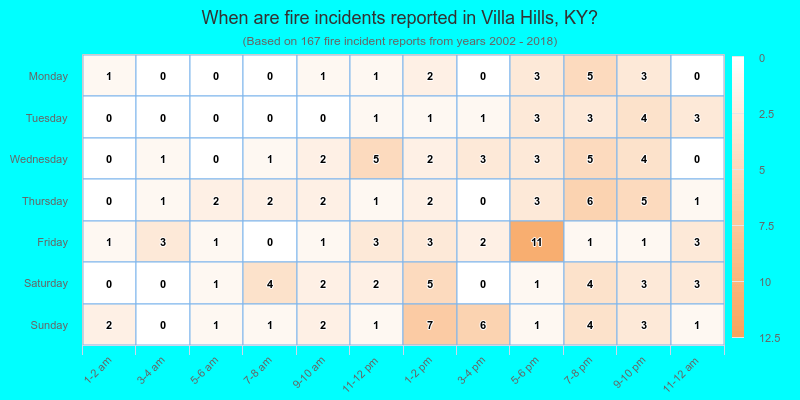
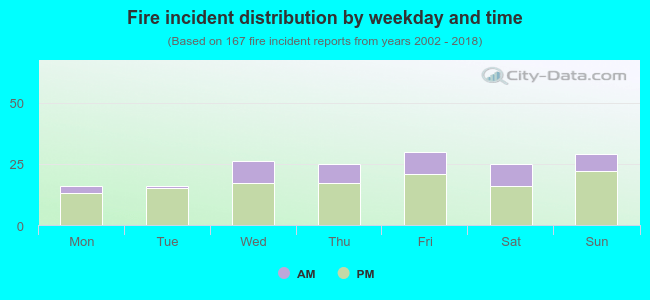 27.5% incidents where reported in the morning and 72.5% in the evening. The most fires (18.0%) took place on Friday, and the least (9.6%) on Monday.
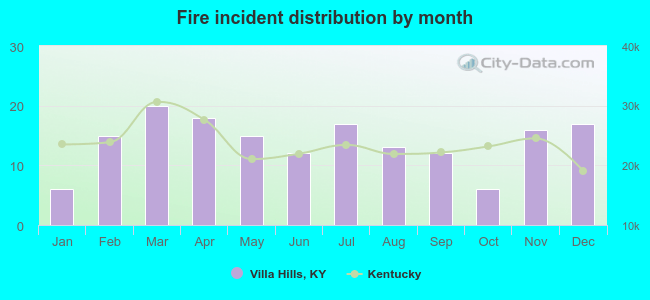 According to the 167 incident reports from years 2002 - 2018 most fires (12.0%) took place during March, and the least (3.6%) in January.
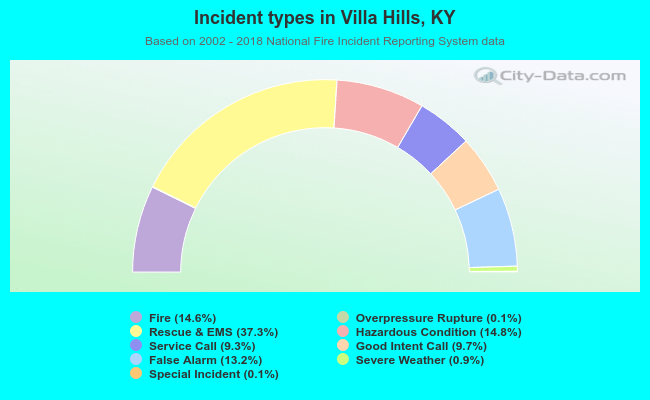 Out of all 1,146 cases reported during the years 2002 - 2018, the most belonged to the categories: Rescue & EMS (37.3%), Hazardous Condition (14.8%), and Fire (14.6%).
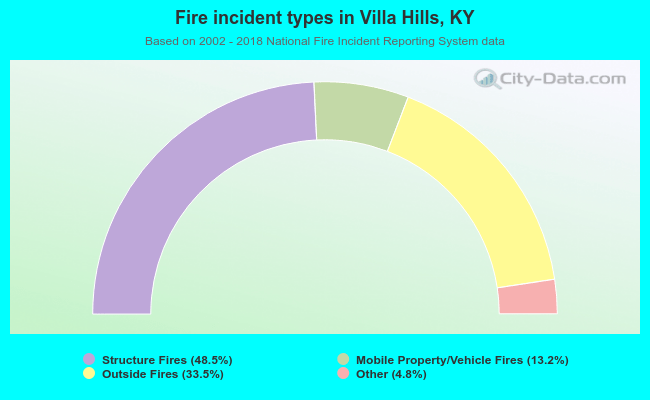 When looking into fire subcategories, the most incidents belonged to: Structure Fires (48.5%), and Outside Fires (33.5%).