Waterville: Fire Incidents, Ohio (OH)
Where are fire incidents reported in Waterville, OH
Something went wrong! Please refresh the page.
|
| |||||||||||||||||||||||||||||||||||||||||||||||||||||||||||||||||||||||||||||||||||||||||||||||||||||||||||||
2002 - 2018 National Fire Incident Reporting System (NFIRS) incidents
- Incident types reported to NFIRS in Waterville, OH
- 1,59963.9%Rescue & EMS
- 27310.9%Fire
- 2208.8%Hazardous Condition
- 1516.0%False Alarm
- 1496.0%Good Intent Call
- 923.7%Service Call
- 160.6%Overpressure Rupture
- 30.1%Severe Weather
- Fire incident types reported to NFIRS in Waterville, OH
- 13649.8%Structure Fires
- 9635.2%Outside Fires
- 4115.0%Mobile Property/Vehicle Fires
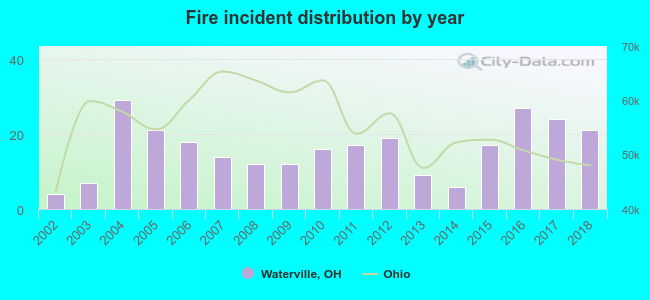 Based on the data from the years 2002 - 2018 the average number of fires per year is 16. The highest number of fires - 29 took place in 2004, and the least - 4 in 2002. The data has a rising trend.
The average number of yearly fire incidents per 10k residents in Waterville, OH compared to nearest cities:
(Note: Based on data for the last 3 years, including only cities with population 5,000 and above)
| Waterville: | 43.5 |
| Perrysburg: | 46.6 |
| Maumee: | 38.2 |
| Bowling Green: | 23.2 |
| Rossford: | 41.5 |
| Toledo: | 41.6 |
| Northwood: | 84.3 |
| Sylvania: | 29.4 |
| Oregon: | 15.7 |

 31.1% incidents where reported in the morning and 68.9% in the evening. The most fires (17.9%) took place on Friday, and the least (8.1%) on Thursday.
 Based on the 273 incident reports from years 2002 - 2018 most fires (11.4%) took place during April, and the least (5.1%) in August.
 Out of all 2,504 cases reported during the years 2002 - 2018, the most belonged to the categories: Rescue & EMS (63.9%), Fire (10.9%), and Hazardous Condition (8.8%).
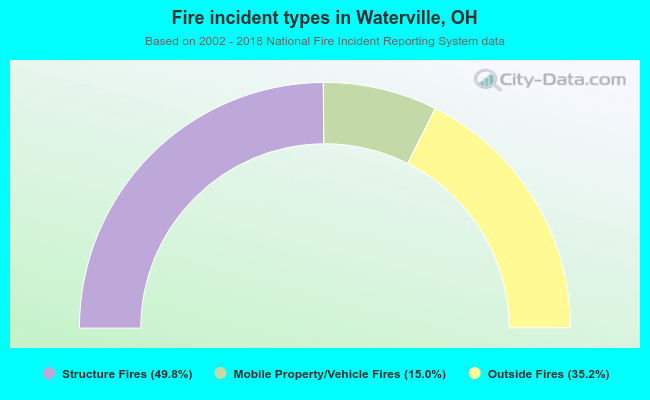 When looking into fire subcategories, the most incidents belonged to: Structure Fires (49.8%), and Outside Fires (35.2%).