Wauwatosa: Fire Incidents, Wisconsin (WI)
Where are fire incidents reported in Wauwatosa, WI
Something went wrong! Please refresh the page.
| Fire incidents reported | |
|---|---|
| Sreet name | Count |
| MAYFAIR RD | 120 |
| 124TH ST | 44 |
| NORTH AVE | 44 |
| BLUEMOUND RD | 42 |
| MAYFAIR | 42 |
| STATE ST | 40 |
| CAPITOL DR | 34 |
| NORTH | 34 |
| WATERTOWN PLANK RD | 34 |
| WISCONSIN AVE | 34 |
| NORTH AV | 32 |
| CAPITOL | 28 |
| BURLEIGH ST | 26 |
| CENTER ST | 26 |
| 124 | 22 |
| 68TH ST | 22 |
| US 45 FWY | 22 |
| WISCONSIN | 20 |
| BLUEMOUND | 18 |
| GLENVIEW PL | 16 |
| WELLS ST | 16 |
| WISCONSIN AV | 14 |
| 63 | 12 |
| 65TH ST | 12 |
| 70TH ST | 12 |
| 92ND ST | 12 |
| BURLEIGH | 12 |
| DEWEY AV | 12 |
| DIANE DR | 12 |
| MARTHA WASHINGTON DR | 12 |
| Other | 151 |
2002 - 2018 National Fire Incident Reporting System (NFIRS) incidents
- Incident types reported to NFIRS in Wauwatosa, WI
- 23,13169.2%Rescue & EMS
- 3,3099.9%False Alarm
- 2,6798.0%Service Call
- 1,5064.5%Hazardous Condition
- 1,4964.5%Good Intent Call
- 9772.9%Fire
- 1500.4%Overpressure Rupture
- 930.3%Severe Weather
- 640.2%Special Incident
- Fire incident types reported to NFIRS in Wauwatosa, WI
- 42043.0%Structure Fires
- 27428.0%Outside Fires
- 21421.9%Mobile Property/Vehicle Fires
- 697.1%Other
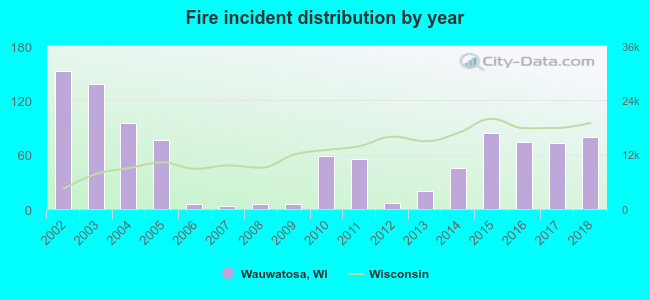 Based on the data from the years 2002 - 2018 the average number of fires per year is 57. The highest number of reported fire incidents - 152 took place in 2002, and the least - 3 in 2007. The data has a decreasing trend.
The average number of yearly fire incidents per 10k residents in Wauwatosa, WI compared to nearest cities:
(Note: Based on data for the last 3 years, including only cities with population 5,000 and above)
| Wauwatosa: | 16.1 |
| Elm Grove: | 13.0 |
| West Allis: | 18.9 |
| Milwaukee: | 33.6 |
| Brookfield: | 23.3 |
| Greenfield: | 14.3 |
| New Berlin: | 28.9 |
| Glendale: | 23.0 |
| Whitefish Bay: | 7.1 |
 The median response time based on all reported fire incidents is 6 minutes. This is comparable to the state median value.
The median response time in Wauwatosa, WI compared to nearest cities:
(Note: Based on data for all years, including only cities with at least 500 fire incidents)
| Wauwatosa: | 6 minutes |
| West Allis: | 4 minutes |
| Milwaukee: | 4 minutes |
| Brookfield: | 7 minutes |
| Greenfield: | 6 minutes |
| New Berlin: | 7 minutes |
| Menomonee Falls: | 6 minutes |
| Franklin: | 6 minutes |
| Sussex: | 9 minutes |
 Based on the data from the years 2002 - 2018 the average number of fire-related casualties per year is 2. The highest number of reported injuries - 10 took place in 2004, and the lowest - 0 in 2006. The data has a dropping trend.
The average number of casualties per 1,000 fire incidents is 16. This indicator was the highest - 105 in 2004, and the lowest 0 in 2006. The trend for injuries per 1,000 fires is declining. Compared to the state value the number of casualties per 1,000 fires is much higher.
Based on the data from the years 2002 - 2018 the average number of fire-related casualties per year is 2. The highest number of reported injuries - 10 took place in 2004, and the lowest - 0 in 2006. The data has a dropping trend.
The average number of casualties per 1,000 fire incidents is 16. This indicator was the highest - 105 in 2004, and the lowest 0 in 2006. The trend for injuries per 1,000 fires is declining. Compared to the state value the number of casualties per 1,000 fires is much higher.Casualties per 1,000 incidents in Wauwatosa, WI compared to nearest cities:
(Note: Based on data for all years, including only cities with at least 500 fire incidents)
| Wauwatosa: | 28.7 |
| West Allis: | 53.5 |
| Milwaukee: | 1.6 |
| Brookfield: | 21.0 |
| Greenfield: | 4.0 |
| New Berlin: | 7.1 |
| Menomonee Falls: | 15.4 |
| Franklin: | 11.6 |
| Sussex: | 10.1 |
 30.3% incidents where reported in the morning and 69.7% in the evening. The most fires (15.7%) took place on Sunday, and the least (13.3%) on Tuesday.
 Based on the 977 fire incident reports from years 2002 - 2018 most fires (12.6%) took place during June, and the least (5.5%) in January.
 Out of all 33,405 cases reported during the years 2002 - 2018, the most belonged to the categories: Rescue & EMS (69.2%), False Alarm (9.9%), and Service Call (8.0%).
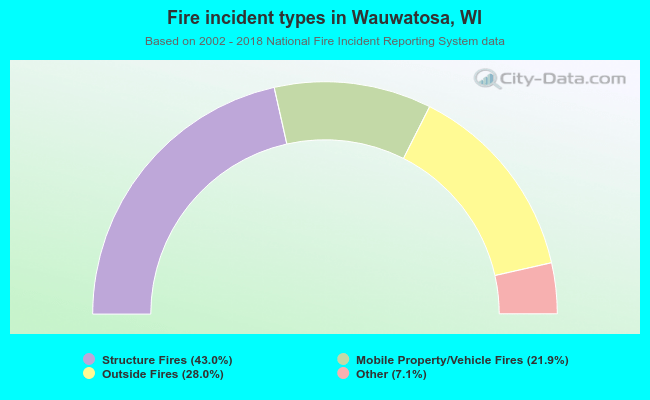 When looking into fire subcategories, the most reports belonged to: Structure Fires (43.0%), and Outside Fires (28.0%).