Wellesley: Fire Incidents, Massachusetts (MA)
Where are fire incidents reported in Wellesley, MA
Something went wrong! Please refresh the page.
| Fire incidents reported | |
|---|---|
| Sreet name | Count |
| CENTRAL ST | 310 |
| WASHINGTON ST | 294 |
| FOREST ST | 252 |
| WORCESTER ST | 172 |
| WESTON RD | 86 |
| LINDEN ST | 82 |
| OAKLAND ST | 54 |
| BARTON RD | 42 |
| GREAT PLAIN AVE | 36 |
| WALNUT ST | 36 |
| CEDAR ST | 30 |
| ELMWOOD RD | 28 |
| WELLESLEY AVE | 28 |
| KINGSBURY ST | 26 |
| GROVE ST | 24 |
| BENVENUE ST | 20 |
| WILLIAM ST | 18 |
| BROOK ST | 16 |
| INTERSTATE 95 HWY | 16 |
| MAUGUS AVE | 16 |
| OAK ST | 16 |
| RIVER ST | 16 |
| STANDISH RD | 14 |
| ABBOTT RD | 12 |
| ALBION RD | 12 |
| GLEN RD | 12 |
| INTERSTATE 95 (RT 128 N) HWY | 12 |
| TURNER RD | 12 |
| BEECHWOOD RD | 10 |
| BRISTOL RD | 10 |
2002 - 2018 National Fire Incident Reporting System (NFIRS) incidents
- Incident types reported to NFIRS in Wellesley, MA
- 11,26739.0%Rescue & EMS
- 6,92824.0%False Alarm
- 5,60319.4%Hazardous Condition
- 2,1117.3%Service Call
- 1,5805.5%Good Intent Call
- 1,3254.6%Fire
- Fire incident types reported to NFIRS in Wellesley, MA
- 84563.8%Structure Fires
- 25118.9%Outside Fires
- 13610.3%Mobile Property/Vehicle Fires
- 937.0%Other
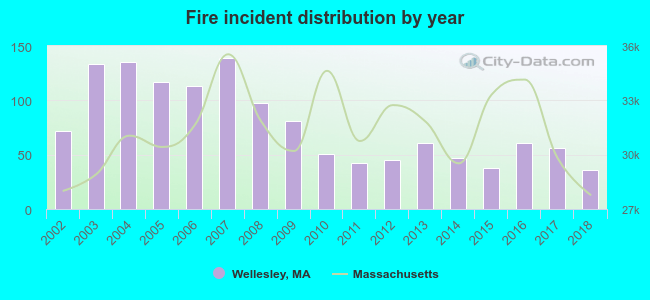 According to the data from the years 2002 - 2018 the average number of fires per year is 78. The highest number of fire incidents - 139 took place in 2007, and the least - 36 in 2018. The data has a dropping trend.
The average number of yearly fire incidents per 10k residents in Wellesley, MA compared to nearest cities:
(Note: Based on data for the last 3 years, including only cities with population 5,000 and above)
| Wellesley: | 18.2 |
| Needham: | 17.8 |
| Natick: | 25.0 |
| Weston: | 34.3 |
| Wayland: | 19.2 |
| Newton: | 29.6 |
| Waltham: | 31.2 |
| Watertown: | 12.2 |
| Framingham: | 89.7 |
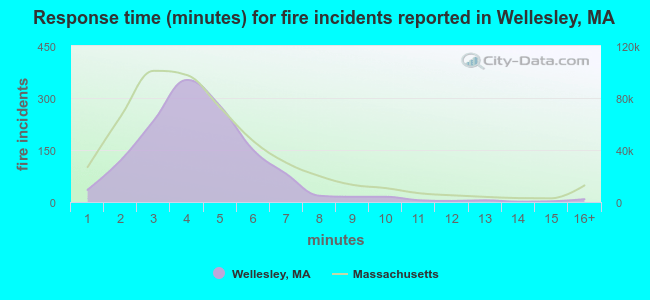 The median response time based on all reported fire incidents is 4 minutes. This is similar to the state median value.
The median response time in Wellesley, MA compared to nearest cities:
(Note: Based on data for all years, including only cities with at least 500 fire incidents)
| Wellesley: | 4 minutes |
| Needham: | 4 minutes |
| Natick: | 5 minutes |
| Weston: | 4 minutes |
| Wayland: | 3 minutes |
| Newton: | 5 minutes |
| Waltham: | 4 minutes |
| Watertown: | 4 minutes |
| Framingham: | 4 minutes |
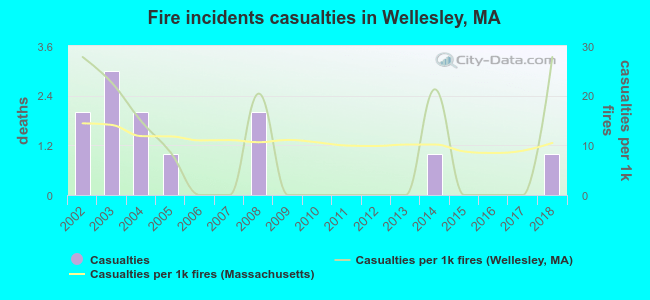 According to the data from the years 2002 - 2018 the average number of fire-related casualties per year is 1. The highest number of injuries - 3 took place in 2003, and the lowest - 0 in 2006. The data has a declining trend.
The average number of injuries per 1,000 fire incidents is 8. This indicator was the highest - 28 in 2002, and the lowest 0 in 2006. The trend for casualties per 1,000 fire incidents is constant. Compared to the Massachusetts value the number of injuries per 1,000 incidents is similar.
According to the data from the years 2002 - 2018 the average number of fire-related casualties per year is 1. The highest number of injuries - 3 took place in 2003, and the lowest - 0 in 2006. The data has a declining trend.
The average number of injuries per 1,000 fire incidents is 8. This indicator was the highest - 28 in 2002, and the lowest 0 in 2006. The trend for casualties per 1,000 fire incidents is constant. Compared to the Massachusetts value the number of injuries per 1,000 incidents is similar.
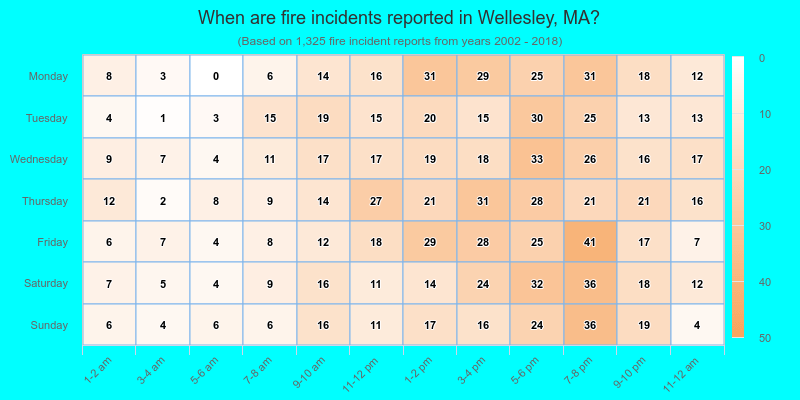
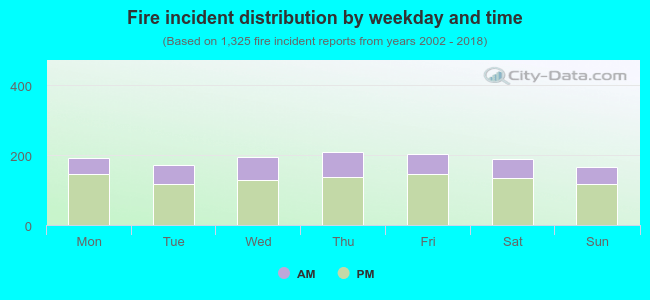 30.0% incidents where reported in the morning and 70.0% in the evening. The most fires (15.8%) took place on Thursday, and the least (12.5%) on Sunday.
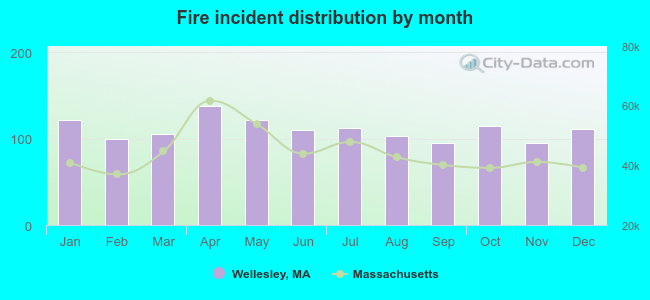 According to the 1,325 fire incident reports from years 2002 - 2018 most fires (10.4%) took place during April, and the least (7.2%) in September.
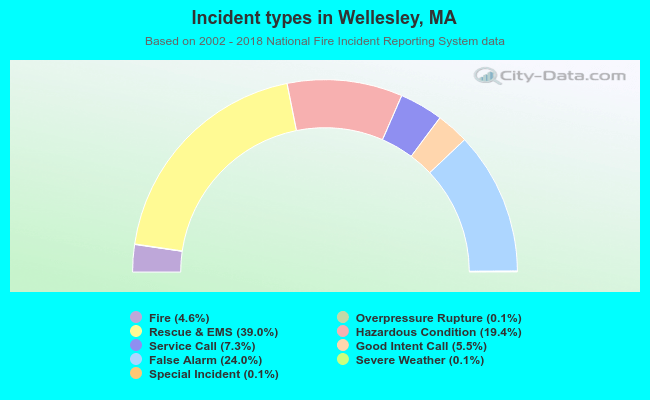 Out of all 28,871 cases reported during the years 2002 - 2018, the most belonged to the categories: Rescue & EMS (39.0%), False Alarm (24.0%), and Hazardous Condition (19.4%).
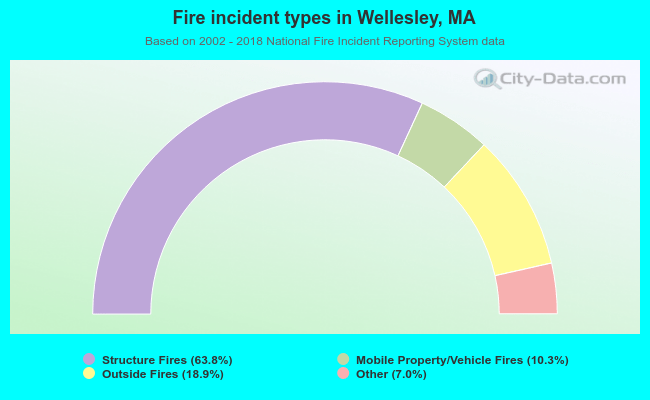 When looking into fire subcategories, the most reports belonged to: Structure Fires (63.8%), and Outside Fires (18.9%).