West Chicago: Fire Incidents, Illinois (IL)
Where are fire incidents reported in West Chicago, IL
Something went wrong! Please refresh the page.
| Fire incidents reported | |
|---|---|
| Sreet name | Count |
| NORTH AVE | 102 |
| ROOSEVELT RD | 102 |
| NELTNOR BLVD | 94 |
| WASHINGTON ST | 76 |
| POWIS RD | 68 |
| PRINCE CROSSING RD | 68 |
| MAIN ST | 54 |
| HARVESTER RD | 50 |
| CARRIAGE DR | 46 |
| NELTNOR BL | 42 |
| NORTH AV | 40 |
| JOLIET ST | 38 |
| KINGS CIR | 38 |
| GATES ST | 34 |
| ELIZABETH ST | 32 |
| HICKORY LN | 32 |
| BLAIR ST | 28 |
| KINGS CT | 28 |
| POMEROY ST | 28 |
| DOWNS DR | 26 |
| HAWTHORNE LN | 26 |
| INDUSTRIAL DR | 26 |
| TOWN RD | 26 |
| FOREST AVE | 24 |
| NATIONAL ST | 24 |
| LOCUST AVE | 22 |
| MORNINGSIDE AVE | 22 |
| ATLANTIC DR | 20 |
| FREMONT ST | 20 |
| HILL CT | 20 |
| Other | 202 |
2003 - 2018 National Fire Incident Reporting System (NFIRS) incidents
- Incident types reported to NFIRS in West Chicago, IL
- 9,00254.4%Rescue & EMS
- 2,07212.5%False Alarm
- 2,07012.5%Hazardous Condition
- 1,4588.8%Fire
- 1,0076.1%Good Intent Call
- 9035.5%Service Call
- Fire incident types reported to NFIRS in West Chicago, IL
- 69147.4%Structure Fires
- 49734.1%Outside Fires
- 21214.5%Mobile Property/Vehicle Fires
- 584.0%Other
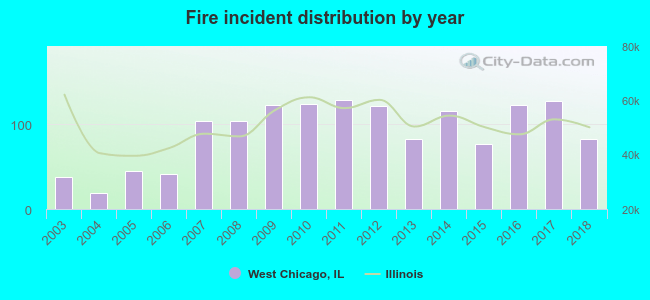 According to the data from the years 2003 - 2018 the average number of fires per year is 91. The highest number of reported fires - 128 took place in 2011, and the least - 19 in 2004. The data has an increasing trend.
The average number of yearly fire incidents per 10k residents in West Chicago, IL compared to nearest cities:
(Note: Based on data for the last 3 years, including only cities with population 5,000 and above)
| West Chicago: | 40.1 |
| Winfield: | 33.8 |
| Carol Stream: | 21.1 |
| Warrenville: | 33.7 |
| Geneva: | 36.2 |
| Wheaton: | 18.3 |
| Batavia: | 30.0 |
| Bartlett: | 17.8 |
| Hanover Park: | 24.4 |
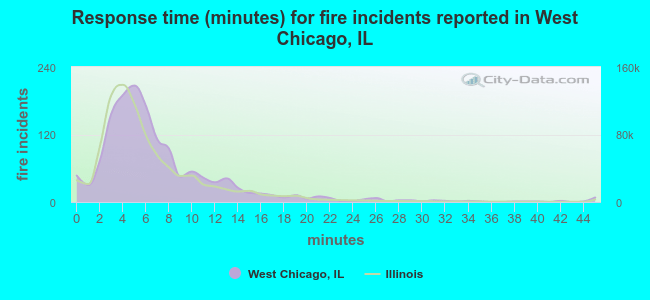 The median response time based on all reported fire incidents is 6 minutes. This is close to the Illinois median value.
The median response time in West Chicago, IL compared to nearest cities:
(Note: Based on data for all years, including only cities with at least 500 fire incidents)
| West Chicago: | 6 minutes |
| Winfield: | 5 minutes |
| Carol Stream: | 5 minutes |
| Warrenville: | 5 minutes |
| Geneva: | 5 minutes |
| St. Charles: | 5 minutes |
| Wheaton: | 5 minutes |
| Batavia: | 5 minutes |
| Bartlett: | 5 minutes |
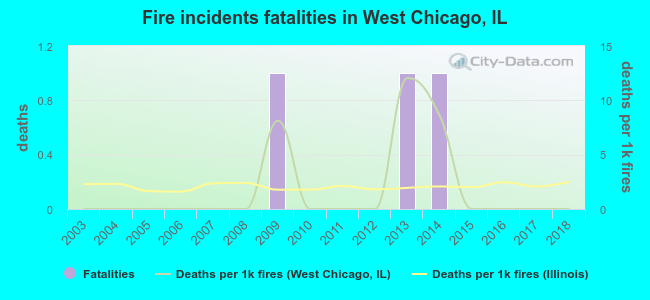 Based on the data from the years 2003 - 2018 the average number of fire-related yearly deaths is 0. The highest number of deaths - 1 took place in 2009, and the lowest - 0 in 2003. The data has a constant trend.
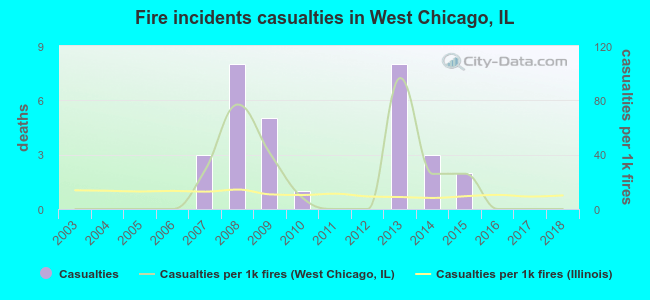 Based on the data from the years 2003 - 2018 the average number of fire-related casualties per year is 2. The highest number of injuries - 8 took place in 2008, and the lowest - 0 in 2003. The data has a constant trend.
The average number of casualties per 1,000 fire incidents is 19. This indicator was the highest - 96 in 2013, and the lowest 0 in 2003. The trend for injuries per 1,000 fires is decreasing. Compared to the state value the number of casualties per 1,000 fires is higher.
Based on the data from the years 2003 - 2018 the average number of fire-related casualties per year is 2. The highest number of injuries - 8 took place in 2008, and the lowest - 0 in 2003. The data has a constant trend.
The average number of casualties per 1,000 fire incidents is 19. This indicator was the highest - 96 in 2013, and the lowest 0 in 2003. The trend for injuries per 1,000 fires is decreasing. Compared to the state value the number of casualties per 1,000 fires is higher.Casualties per 1,000 incidents in West Chicago, IL compared to nearest cities:
(Note: Based on data for all years, including only cities with at least 500 fire incidents)
| West Chicago: | 20.6 |
| Winfield: | 3.4 |
| Carol Stream: | 7.4 |
| Warrenville: | 33.4 |
| Geneva: | 4.5 |
| St. Charles: | 7.9 |
| Wheaton: | 12.6 |
| Batavia: | 10.8 |
| Bartlett: | 11.6 |
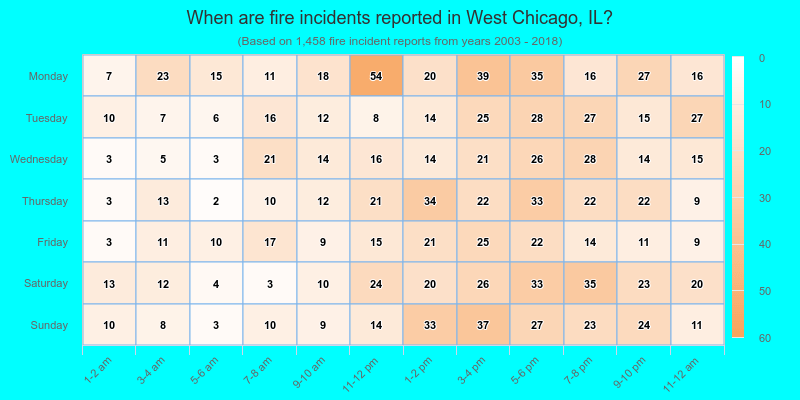
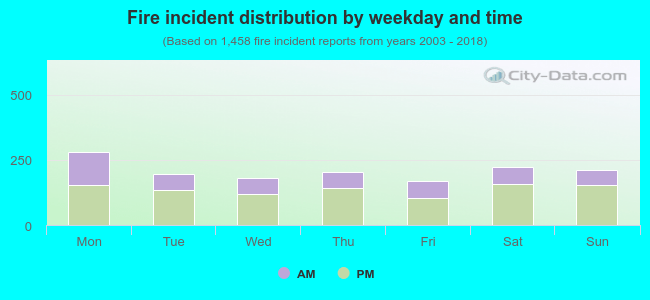 34.0% incidents where reported in the morning and 66.0% in the evening. The most fires (19.3%) took place on Monday, and the least (11.5%) on Friday.
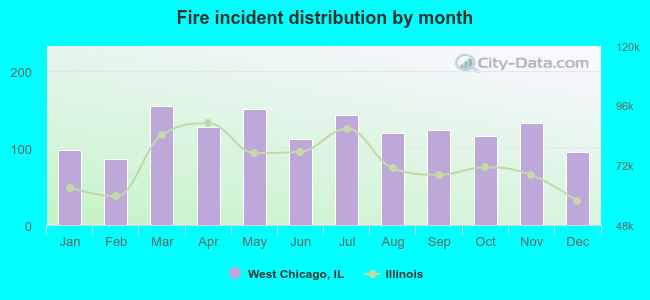 According to the 1,458 fires from years 2003 - 2018 most fires (10.6%) took place during March, and the least (5.9%) in February.
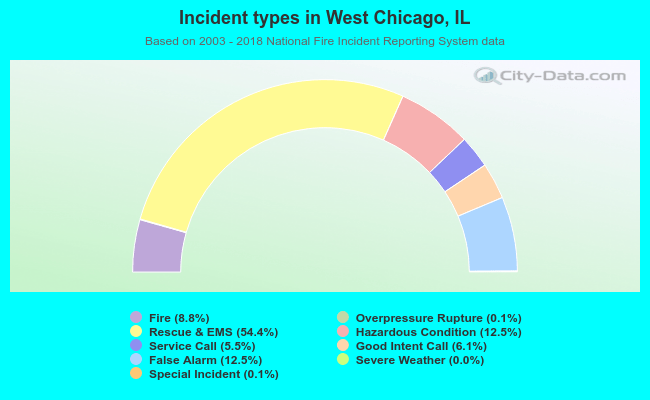 Out of all 16,547 cases reported during the years 2003 - 2018, the most belonged to the categories: Rescue & EMS (54.4%), False Alarm (12.5%), and Hazardous Condition (12.5%).
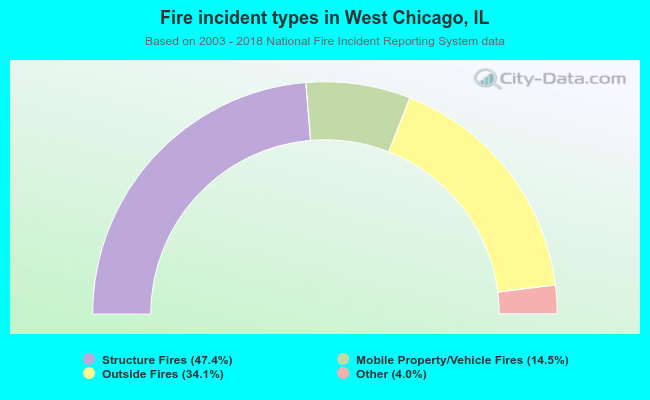 When looking into fire subcategories, the most reports belonged to: Structure Fires (47.4%), and Outside Fires (34.1%).