Weymouth: Fire Incidents, Massachusetts (MA)
Where are fire incidents reported in Weymouth, MA
Something went wrong! Please refresh the page.
| Fire incidents reported | |
|---|---|
| Sreet name | Count |
| MIDDLE ST | 432 |
| MAIN ST | 348 |
| BRIDGE ST | 322 |
| WASHINGTON ST | 314 |
| BROAD ST | 210 |
| COMMERCIAL ST | 164 |
| PLEASANT ST | 146 |
| MEDITERRANEAN DR | 140 |
| BRIDGE ST 671-831 ODD | 120 |
| QUEEN ANNE CT | 102 |
| QUEEN ANNE DR | 100 |
| BROAD ST 1-220 | 94 |
| POND ST | 86 |
| COLONEL'S DR | 78 |
| FRONT ST | 78 |
| WINTER ST | 78 |
| BROAD REACH | 74 |
| QUEEN ANNE DR | 72 |
| BROAD ST 464-709 | 70 |
| QUEEN ANNE CT | 70 |
| WASHINGTON ST 516-775 | 70 |
| MIDDLE ST 552-676 EVEN | 68 |
| COLONEL'S LANE | 62 |
| GAS LIGHT DR | 62 |
| LAKE ST 152-330 | 58 |
| MEDITERRANEAN DR | 58 |
| SCHOOL HOUSE RD | 58 |
| COLONELS DR | 56 |
| GREENTREE LANE | 56 |
| POND ST 1-114 | 56 |
| Other | 1,845 |
2002 - 2018 National Fire Incident Reporting System (NFIRS) incidents
- Incident types reported to NFIRS in Weymouth, MA
- 26,30749.2%Rescue & EMS
- 9,13717.1%Hazardous Condition
- 5,54710.4%Fire
- 4,4698.4%False Alarm
- 4,2097.9%Good Intent Call
- 3,6316.8%Service Call
- 670.1%Special Incident
- Fire incident types reported to NFIRS in Weymouth, MA
- 3,03854.8%Structure Fires
- 1,83233.0%Outside Fires
- 4538.2%Mobile Property/Vehicle Fires
- 2244.0%Other
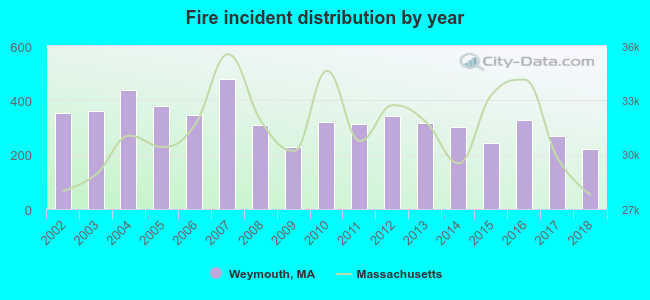 Based on the data from the years 2002 - 2018 the average number of fire incidents per year is 326. The highest number of reported fires - 478 took place in 2007, and the least - 222 in 2018. The data has a decreasing trend.
The average number of yearly fire incidents per 10k residents in Weymouth, MA compared to nearest cities:
(Note: Based on data for the last 3 years, including only cities with population 5,000 and above)
| Weymouth: | 50.1 |
| Braintree: | 24.7 |
| Hingham: | 140.4 |
| Quincy: | 60.7 |
| Holbrook: | 47.3 |
| Rockland: | 46.9 |
| Randolph: | 60.2 |
| Abington: | 34.0 |
| Hull: | 24.6 |
 The median response time based on all reported fire incidents is 4 minutes. This is similar to the state median value.
The median response time in Weymouth, MA compared to nearest cities:
(Note: Based on data for all years, including only cities with at least 500 fire incidents)
| Weymouth: | 4 minutes |
| Braintree: | 3 minutes |
| Hingham: | 5 minutes |
| Quincy: | 3 minutes |
| Holbrook: | 3 minutes |
| Rockland: | 3 minutes |
| Randolph: | 3 minutes |
| Abington: | 4 minutes |
| Hull: | 3 minutes |
 Based on the reports from the years 2002 - 2018 the average number of fire-related fatalities per year is 0. The highest number of reported deaths - 1 took place in 2004, and the lowest - 0 in 2002. The data has a constant trend.
The average number of deaths per 1,000 fire incidents is 1. This indicator was the highest - 4 in 2017, and the lowest 0 in 2002. The trend for fatalities per 1,000 fire incidents is constant. Compared to the state value the number of fatalities per 1,000 fires is much lower.
Based on the reports from the years 2002 - 2018 the average number of fire-related fatalities per year is 0. The highest number of reported deaths - 1 took place in 2004, and the lowest - 0 in 2002. The data has a constant trend.
The average number of deaths per 1,000 fire incidents is 1. This indicator was the highest - 4 in 2017, and the lowest 0 in 2002. The trend for fatalities per 1,000 fire incidents is constant. Compared to the state value the number of fatalities per 1,000 fires is much lower.
 Based on the data from the years 2002 - 2018 the average number of fire-related casualties per year is 2. The highest number of injuries - 7 took place in 2018, and the lowest - 0 in 2008. The data has a rising trend.
The average number of casualties per 1,000 fires is 7. This indicator was the highest - 32 in 2018, and the lowest 0 in 2008. The trend for casualties per 1,000 fires is increasing. Compared to the state value the number of casualties per 1,000 incidents is lower.
Based on the data from the years 2002 - 2018 the average number of fire-related casualties per year is 2. The highest number of injuries - 7 took place in 2018, and the lowest - 0 in 2008. The data has a rising trend.
The average number of casualties per 1,000 fires is 7. This indicator was the highest - 32 in 2018, and the lowest 0 in 2008. The trend for casualties per 1,000 fires is increasing. Compared to the state value the number of casualties per 1,000 incidents is lower.
 27.1% incidents where reported in the morning and 72.9% in the evening. The most fires (16.2%) took place on Sunday, and the least (13.2%) on Friday.
 Based on the 5,547 fire incident reports from years 2002 - 2018 most fires (10.9%) took place during April, and the least (6.3%) in October.
 Out of all 53,439 cases reported during the years 2002 - 2018, the most belonged to the categories: Rescue & EMS (49.2%), Hazardous Condition (17.1%), and Fire (10.4%).
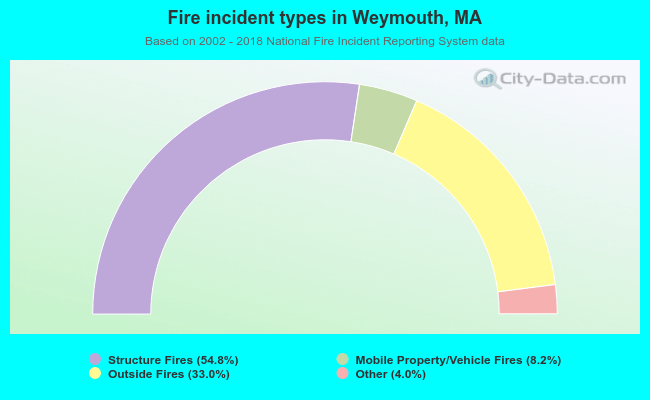 When looking into fire subcategories, the most reports belonged to: Structure Fires (54.8%), and Outside Fires (33.0%).