Wildwood: Fire Incidents, New Jersey (NJ)
Where are fire incidents reported in Wildwood, NJ
Something went wrong! Please refresh the page.
| Fire incidents reported | |
|---|---|
| Sreet name | Count |
| NEW JERSEY AVE | 1,052 |
| BOARDWALK | 220 |
| RIO GRANDE AVE | 188 |
| PACIFIC AVE | 132 |
| ATLANTIC AVE | 98 |
| PARK BLVD | 92 |
| ARCTIC AVE | 78 |
| MONTGOMERY AVE | 74 |
| OCEAN AVE | 68 |
| GARFIELD AVE | 66 |
| DAVIS AVE | 64 |
| POPLAR AVE | 64 |
| WILDWOOD AVE | 60 |
| BURK AVE | 54 |
| PINE AVE | 54 |
| OAK AVE | 52 |
| ROBERTS AVE | 52 |
| MAGNOLIA AVE | 50 |
| TAYLOR AVE | 50 |
| MAPLE AVE | 46 |
| YOUNGS AVE | 46 |
| SPENCER AVE | 44 |
| GLENWOOD AVE | 42 |
| ANDREWS AVE | 40 |
| LINCOLN AVE | 38 |
| BAKER AVE | 36 |
| SCHELLENGER AVE | 32 |
| LEAMING AVE | 30 |
| NEW YORK AVE | 30 |
| SPICER AVE | 26 |
2002 - 2018 National Fire Incident Reporting System (NFIRS) incidents
- Incident types reported to NFIRS in Wildwood, NJ
- 2,46126.8%Hazardous Condition
- 2,17323.7%Rescue & EMS
- 1,78719.5%False Alarm
- 1,73918.9%Fire
- 5315.8%Service Call
- 4745.2%Good Intent Call
- 100.1%Special Incident
- Fire incident types reported to NFIRS in Wildwood, NJ
- 1,15366.3%Structure Fires
- 44825.8%Outside Fires
- 864.9%Mobile Property/Vehicle Fires
- 523.0%Other
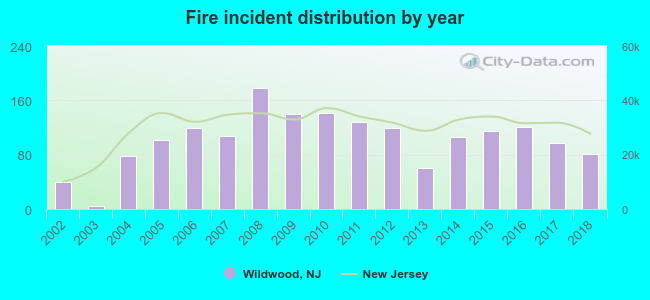 According to the data from the years 2002 - 2018 the average number of fires per year is 102. The highest number of reported fire incidents - 178 took place in 2008, and the least - 5 in 2003. The data has an increasing trend.
The average number of yearly fire incidents per 10k residents in Wildwood, NJ compared to nearest cities:
(Note: Based on data for the last 3 years, including only cities with population 5,000 and above)
| Wildwood: | 192.2 |
| Cape May Court House: | 50.0 |
| Villas: | 27.4 |
| Ocean City: | 41.3 |
| Somers Point: | 43.1 |
| Linwood: | 12.3 |
| Margate City: | 34.2 |
| Northfield: | 31.0 |
| Millville: | 48.9 |
 The median response time based on all reported fire incidents is 2 minutes. This is much lower than the state median value.
The median response time in Wildwood, NJ compared to nearest cities:
(Note: Based on data for all years, including only cities with at least 500 fire incidents)
| Wildwood: | 2 minutes |
| Rio Grande: | 3 minutes |
| Cape May Court House: | 5 minutes |
| Villas: | 3 minutes |
| Ocean City: | 2 minutes |
| Lewes: | 8 minutes |
| Rehoboth Beach: | 6 minutes |
| Somers Point: | 6 minutes |
| Millville: | 6 minutes |
 Based on the reports from the years 2002 - 2018 the average number of fire-related casualties per year is 2. The highest number of casualties - 6 took place in 2005, and the lowest - 0 in 2002. The data has a growing trend.
The average number of injuries per 1,000 fires is 13. This indicator was the highest - 59 in 2005, and the lowest 0 in 2002. The trend for casualties per 1,000 fires is increasing. Compared to the state value the number of casualties per 1,000 fires is higher.
Based on the reports from the years 2002 - 2018 the average number of fire-related casualties per year is 2. The highest number of casualties - 6 took place in 2005, and the lowest - 0 in 2002. The data has a growing trend.
The average number of injuries per 1,000 fires is 13. This indicator was the highest - 59 in 2005, and the lowest 0 in 2002. The trend for casualties per 1,000 fires is increasing. Compared to the state value the number of casualties per 1,000 fires is higher.Casualties per 1,000 incidents in Wildwood, NJ compared to nearest cities:
(Note: Based on data for all years, including only cities with at least 500 fire incidents)
| Wildwood: | 15.0 |
| Rio Grande: | 1.9 |
| Cape May Court House: | 11.8 |
| Villas: | 7.4 |
| Ocean City: | 12.1 |
| Lewes: | 0.0 |
| Rehoboth Beach: | 7.7 |
| Somers Point: | 8.7 |
| Millville: | 10.9 |
 29.6% incidents where reported in the morning and 70.4% in the evening. The most fires (16.0%) took place on Wednesday, and the least (12.0%) on Thursday.
 Based on the 1,739 fire incidents from years 2002 - 2018 most fires (12.0%) took place during May, and the least (4.5%) in February.
 Out of all 9,183 cases reported during the years 2002 - 2018, the most belonged to the categories: Hazardous Condition (26.8%), Rescue & EMS (23.7%), and False Alarm (19.5%).
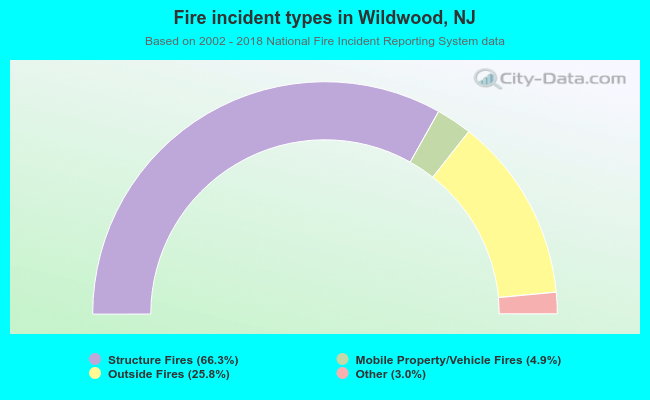 When looking into fire subcategories, the most incidents belonged to: Structure Fires (66.3%), and Outside Fires (25.8%).