Winter Springs: Fire Incidents, Florida (FL)
Where are fire incidents reported in Winter Springs, FL
Something went wrong! Please refresh the page.
| Fire incidents reported | |
|---|---|
| Sreet name | Count |
| E SR 434 | 78 |
| TUSKAWILLA RD | 42 |
| RED BUG LAKE RD | 38 |
| CORY LN | 26 |
| SHEOAH BLVD | 26 |
| SR 434 | 26 |
| LORI ANNE LN | 24 |
| RED BUG LAKE RD | 24 |
| OLD SANFORD OVIEDO RD | 22 |
| EDGEMON AVE | 18 |
| ENGLISH TOWN LN | 18 |
| S MOSS RD | 18 |
| SR 419 | 18 |
| N EDGEMON AVE | 16 |
| TIVERTON ST | 16 |
| TUSKAWILLA RD | 16 |
| WILLA SPRINGS DR | 16 |
| CHATHAM PINES CIR | 14 |
| LAUREL OAKS DR | 14 |
| TRADE WINDS RD | 14 |
| W SR 434 | 14 |
| DUNCAN DR | 12 |
| GAZELL TRL | 12 |
| N DEVON AVE | 12 |
| N US 17 92 | 12 |
| NORTHERN WAY | 12 |
| TUSKAWILLA RD / E SR 434 | 12 |
| WINTER SPRINGS BLVD | 12 |
| ALDERWOOD ST | 10 |
| ANTELOPE TRL | 10 |
| Other | 597 |
2003 - 2018 National Fire Incident Reporting System (NFIRS) incidents
- Incident types reported to NFIRS in Winter Springs, FL
- 9,36159.0%Rescue & EMS
- 1,60210.1%Service Call
- 1,4459.1%Good Intent Call
- 1,4279.0%Hazardous Condition
- 1,1997.6%Fire
- 8025.1%False Alarm
- Fire incident types reported to NFIRS in Winter Springs, FL
- 52643.9%Structure Fires
- 45437.9%Outside Fires
- 16313.6%Mobile Property/Vehicle Fires
- 564.7%Other
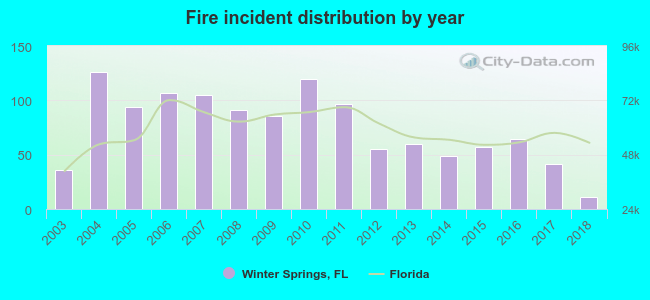 Based on the data from the years 2003 - 2018 the average number of fires per year is 75. The highest number of reported fires - 126 took place in 2004, and the least - 11 in 2018. The data has a dropping trend.
The average number of yearly fire incidents per 10k residents in Winter Springs, FL compared to nearest cities:
(Note: Based on data for the last 3 years, including only cities with population 5,000 and above)
| Winter Springs: | 11.3 |
| Casselberry: | 16.5 |
| Longwood: | 38.7 |
| Fern Park: | 13.8 |
| Lake Mary: | 18.4 |
| Oviedo: | 19.3 |
| Sanford: | 49.8 |
| Maitland: | 21.6 |
| Altamonte Springs: | 16.7 |
 The median response time based on all reported fire incidents is 5 minutes. This is lower compared to the Florida median value.
The median response time in Winter Springs, FL compared to nearest cities:
(Note: Based on data for all years, including only cities with at least 500 fire incidents)
| Winter Springs: | 5 minutes |
| Casselberry: | 5 minutes |
| Longwood: | 5 minutes |
| Lake Mary: | 6 minutes |
| Oviedo: | 6 minutes |
| Sanford: | 6 minutes |
| Maitland: | 5 minutes |
| Altamonte Springs: | 5 minutes |
| Winter Park: | 6 minutes |
 According to the reports from the years 2003 - 2018 the average number of fire-related yearly deaths is 0. The highest number of deaths - 1 took place in 2010, and the lowest - 0 in 2003. The data has a constant trend.
 According to the reports from the years 2003 - 2018 the average number of fire-related casualties per year is 3. The highest number of reported injuries - 6 took place in 2004, and the lowest - 0 in 2006. The data has a declining trend.
The average number of injuries per 1,000 fires is 36. This indicator was the highest - 83 in 2013, and the lowest 0 in 2006. The trend for injuries per 1,000 incidents is dropping. Compared to the state value the number of injuries per 1,000 incidents is much higher.
According to the reports from the years 2003 - 2018 the average number of fire-related casualties per year is 3. The highest number of reported injuries - 6 took place in 2004, and the lowest - 0 in 2006. The data has a declining trend.
The average number of injuries per 1,000 fires is 36. This indicator was the highest - 83 in 2013, and the lowest 0 in 2006. The trend for injuries per 1,000 incidents is dropping. Compared to the state value the number of injuries per 1,000 incidents is much higher.Casualties per 1,000 incidents in Winter Springs, FL compared to nearest cities:
(Note: Based on data for all years, including only cities with at least 500 fire incidents)
| Winter Springs: | 36.7 |
| Casselberry: | 20.4 |
| Longwood: | 29.7 |
| Lake Mary: | 20.7 |
| Oviedo: | 28.8 |
| Sanford: | 13.4 |
| Maitland: | 14.0 |
| Altamonte Springs: | 43.1 |
| Winter Park: | 24.3 |
 27.7% incidents where reported in the morning and 72.3% in the evening. The most fires (15.2%) took place on Wednesday, and the least (12.2%) on Monday.
 According to the 1,199 fire incidents from years 2003 - 2018 most fires (10.3%) took place during March, and the least (6.6%) in September.
 Out of all 15,858 cases reported during the years 2003 - 2018, the most belonged to the categories: Rescue & EMS (59.0%), Service Call (10.1%), and Good Intent Call (9.1%).
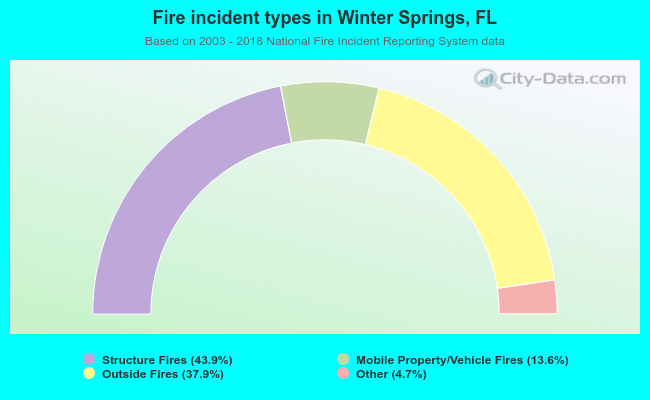 When looking into fire subcategories, the most incidents belonged to: Structure Fires (43.9%), and Outside Fires (37.9%).