Winton: Fire Incidents, California (CA)
Where are fire incidents reported in Winton, CA
Something went wrong! Please refresh the page.
|
| |||||||||||||||||||||||||||||||||||||||||||||||||||||||||||||||||||||||||||||||||||||||||||||||||||||||||||||
2004 - 2018 National Fire Incident Reporting System (NFIRS) incidents
- Incident types reported to NFIRS in Winton, CA
- 3,53465.9%Rescue & EMS
- 70013.1%Fire
- 55310.3%Good Intent Call
- 2494.6%False Alarm
- 1923.6%Service Call
- 1292.4%Hazardous Condition
- Fire incident types reported to NFIRS in Winton, CA
- 39756.7%Outside Fires
- 14120.1%Mobile Property/Vehicle Fires
- 13519.3%Structure Fires
- 273.9%Other
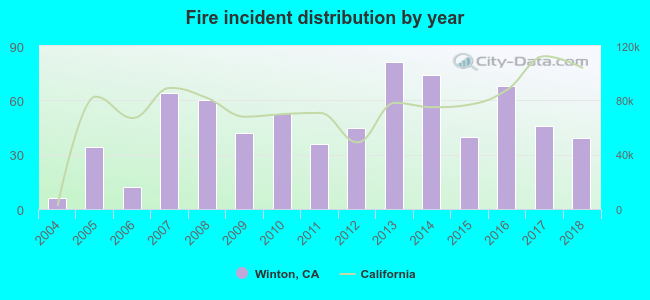 According to the data from the years 2004 - 2018 the average number of fires per year is 47. The highest number of reported fire incidents - 81 took place in 2013, and the least - 6 in 2004. The data has a growing trend.
The average number of yearly fire incidents per 10k residents in Winton, CA compared to nearest cities:
(Note: Based on data for the last 3 years, including only cities with population 5,000 and above)
| Winton: | 48.1 |
| Atwater: | 23.0 |
| Livingston: | 21.0 |
| Merced: | 60.0 |
| Delhi: | 81.2 |
| Turlock: | 16.4 |
| Waterford: | 54.2 |
| Hughson: | 25.4 |
| Keyes: | 22.3 |
 The median response time based on all reported fire incidents is 6 minutes. This is similar to the state median value.
The median response time in Winton, CA compared to nearest cities:
(Note: Based on data for all years, including only cities with at least 500 fire incidents)
| Winton: | 6 minutes |
| Atwater: | 9 minutes |
| Merced: | 5 minutes |
| Delhi: | 7 minutes |
| Turlock: | 5 minutes |
| Ceres: | 5 minutes |
| Los Banos: | 5 minutes |
| Chowchilla: | 8 minutes |
| Modesto: | 5 minutes |
 35.7% incidents where reported in the morning and 64.3% in the evening. The most fires (16.0%) took place on Saturday, and the least (11.9%) on Thursday.
 According to the 700 reports from years 2004 - 2018 most fires (13.9%) took place during May, and the least (5.1%) in December.
 Out of all 5,362 cases reported during the years 2004 - 2018, the most belonged to the categories: Rescue & EMS (65.9%), Fire (13.1%), and Good Intent Call (10.3%).
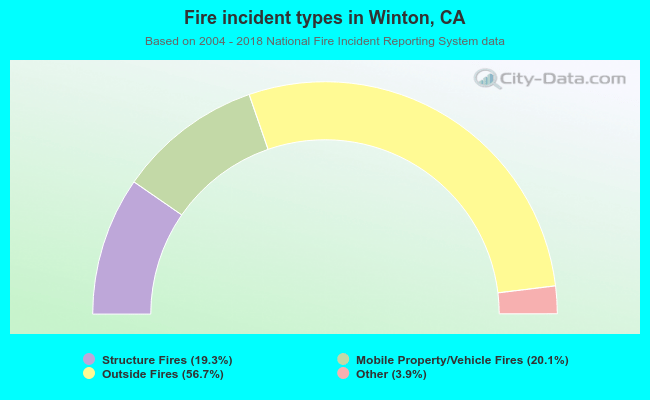 When looking into fire subcategories, the most reports belonged to: Outside Fires (56.7%), and Mobile Property/Vehicle Fires (20.1%).