Wolcott: Fire Incidents, Connecticut (CT)
Where are fire incidents reported in Wolcott, CT
Something went wrong! Please refresh the page.
| Fire incidents reported | |
|---|---|
| Sreet name | Count |
| EDGEMONT LANE | 76 |
| WOLCOTT RD | 58 |
| WOLCOTT ROAD | 58 |
| SPINDLE HILL RD | 50 |
| WOLFS HILL RD | 40 |
| WOODTICK ROAD | 38 |
| MERIDEN ROAD | 30 |
| WOODTICK RD | 26 |
| SPINDLE HILL ROAD | 24 |
| WOLF HILL ROAD | 22 |
| BOUNDLINE RD | 20 |
| BEACH RD | 18 |
| LYMAN RD | 16 |
| TODD RD | 16 |
| BOUNDLINE ROAD | 12 |
| HEMPLE DR | 12 |
| LOWER COUNTY ROAD | 12 |
| POTUCCOS RING RD | 12 |
| ANDREWS ROAD | 10 |
| BEECHER ROAD | 10 |
| CENTER ST | 10 |
| CENTRAL AVENUE | 10 |
| CLINTON HILL RD | 10 |
| COUNTY RD | 10 |
| MERIDEN RD | 10 |
| MUNSON ROAD | 10 |
| RANSOM HALL RD | 10 |
| TOSUN RD | 10 |
| WOLF HILL RD | 10 |
| WOLFS HILLL RD | 10 |
| Other | 134 |
2002 - 2018 National Fire Incident Reporting System (NFIRS) incidents
- Incident types reported to NFIRS in Wolcott, CT
- 1,54435.9%Hazardous Condition
- 89120.7%False Alarm
- 79418.5%Fire
- 3848.9%Rescue & EMS
- 3417.9%Service Call
- 3157.3%Good Intent Call
- 140.3%Overpressure Rupture
- 100.2%Severe Weather
- 60.1%Special Incident
- Fire incident types reported to NFIRS in Wolcott, CT
- 47559.8%Structure Fires
- 21026.4%Outside Fires
- 9912.5%Mobile Property/Vehicle Fires
- 101.3%Other
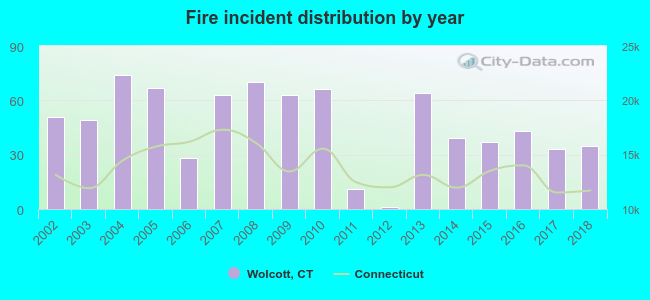 Based on the data from the years 2002 - 2018 the average number of fire incidents per year is 47. The highest number of fires - 74 took place in 2004, and the least - 1 in 2012. The data has a dropping trend.
The average number of yearly fire incidents per 10k residents in Wolcott, CT compared to nearest cities:
(Note: Based on data for the last 3 years, including only cities with population 5,000 and above)
| Wolcott: | 22.2 |
| Waterbury: | 51.4 |
| Southington: | 21.6 |
| Oakville: | 21.0 |
| Plymouth: | 3.7 |
| Terryville: | 26.0 |
| Prospect: | 14.9 |
| Bristol: | 35.6 |
| Watertown: | 17.8 |
 The median response time based on all reported fire incidents is 5 minutes. This is about the same as the Connecticut median value.
The median response time in Wolcott, CT compared to nearest cities:
(Note: Based on data for all years, including only cities with at least 500 fire incidents)
| Wolcott: | 5 minutes |
| Waterbury: | 4 minutes |
| Southington: | 6 minutes |
| Bristol: | 4 minutes |
| Watertown: | 3 minutes |
| Cheshire: | 5 minutes |
| Naugatuck: | 4 minutes |
| Plainville: | 5 minutes |
| Meriden: | 4 minutes |
 Based on the reports from the years 2002 - 2018 the average number of fire-related casualties per year is 0. The highest number of reported injuries - 1 took place in 2005, and the lowest - 0 in 2002. The data has a constant trend.
The average number of casualties per 1,000 fires is 5. This indicator was the highest - 36 in 2006, and the lowest 0 in 2002. The trend for casualties per 1,000 incidents is constant. Compared to the Connecticut value the number of casualties per 1,000 fires is much lower.
Based on the reports from the years 2002 - 2018 the average number of fire-related casualties per year is 0. The highest number of reported injuries - 1 took place in 2005, and the lowest - 0 in 2002. The data has a constant trend.
The average number of casualties per 1,000 fires is 5. This indicator was the highest - 36 in 2006, and the lowest 0 in 2002. The trend for casualties per 1,000 incidents is constant. Compared to the Connecticut value the number of casualties per 1,000 fires is much lower.Casualties per 1,000 incidents in Wolcott, CT compared to nearest cities:
(Note: Based on data for all years, including only cities with at least 500 fire incidents)
| Wolcott: | 5.0 |
| Waterbury: | 13.0 |
| Southington: | 23.5 |
| Bristol: | 25.9 |
| Watertown: | 10.0 |
| Cheshire: | 13.2 |
| Naugatuck: | 17.2 |
| Plainville: | 31.2 |
| Meriden: | 12.3 |
 30.0% incidents where reported in the morning and 70.0% in the evening. The most fires (16.6%) took place on Tuesday, and the least (13.0%) on Thursday.
 Based on the 794 reports from years 2002 - 2018 most fires (13.1%) took place during April, and the least (4.3%) in September.
 Out of all 4,299 cases reported during the years 2002 - 2018, the most belonged to the categories: Hazardous Condition (35.9%), False Alarm (20.7%), and Fire (18.5%).
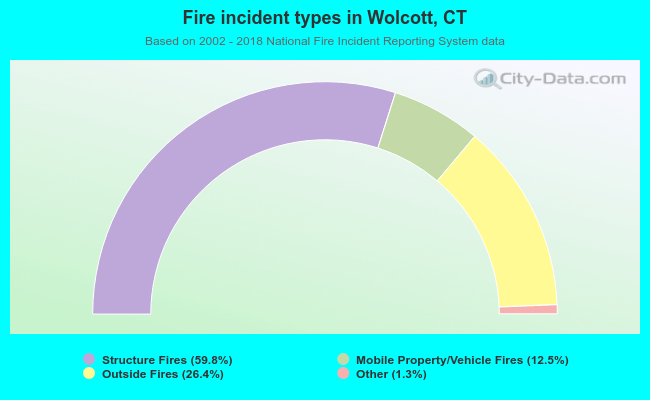 When looking into fire subcategories, the most incidents belonged to: Structure Fires (59.8%), and Outside Fires (26.4%).