| Fire incidents reported |
|---|
| Sreet name | Count |
|---|
| MAIN ST | 46 | | COOKSTOWN NEW EGYPT RD | 16 | | WRIGHTSTOWN SYKESVILLE RD | 16 | | MEANY RD | 14 | | FRANCIS ST | 12 | | MAIN / WRIGHTSTOWN ST | 12 | | MONMOUTH RD | 12 | | BYRON DR | 10 | | COOKSTOWN-NEW EGYPT RD | 10 | | FT. DIX ST | 10 | | FT DIX ST | 8 | | JACOBSTOWN - CHESTERFIELD RD | 8 | | JACOBSTOWN NEW EGYPT RD | 8 | | MARTHA AVE | 8 | | RANGE RD | 8 | | COOKSTOWN WRIGHTSTOWN RD | 6 | | FORT DIX ST | 6 | | JACOBSTOWN CHESTERFIELD RD | 6 | | JONES MILLS RD | 6 | | JONESMILL RD | 6 | | SAYLORS POND RD | 6 | | SCHOOLHOUSE RD | 6 | | SYKESVILLE RD | 6 | | WRIGHTSTOWN - SYKESVILLE RD | 6 | | WRIGHTSTOWN-SYKESVILLE RD | 6 |
| | | Fire incidents reported |
|---|
| Sreet name | Count |
|---|
| BRYON DR | 4 | | CHESTERFIELD ARNYSTOWN RD | 4 | | COOKSTOWN JACOBSTOWN RD | 4 | | COOKSTOWNNEW EGYPT RD | 4 | | CROSHAW RD | 4 | | CROWSHAW RD | 4 | | FARAGO BLVD | 4 | | GEORGETOWN RD | 4 | | HANOVER DR | 4 | | JONES MILL RD | 4 | | MARTHA | 4 | | MARTHA AVE | 4 | | MEETING HOUSE RD | 4 | | MYRON BLVD | 4 | | RAILROAD AVE | 4 | | RTE 528 | 4 | | WHITE PINE RD | 4 | | WRIGHTSTOWN ARMS APTS | 4 | | WRIGHTSTOWN COOKSTOWN RD | 4 | | WRIGHTSTOWN GEORGETOWN RD | 4 | | AMBROSE DR | 2 | | ANDREA DR | 2 | | BEACH ST | 2 | | BRENNER ST | 2 | | BUNTING BRIDGE RD | 2 |
|
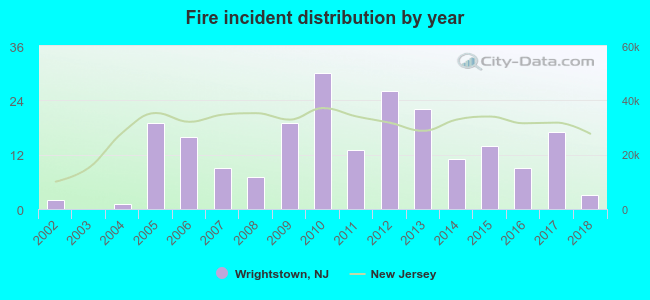 Based on the data from the years 2002 - 2018 the average number of fire incidents per year is 13. The highest number of reported fires - 30 took place in 2010, and the least - 0 in 2003. The data has an increasing trend.
 29.4% incidents where reported in the morning and 70.6% in the evening. The most fires (18.3%) took place on Tuesday, and the least (11.9%) on Monday.
 Based on the 218 incident reports from years 2002 - 2018 most fires (13.8%) took place during April, and the least (4.1%) in September.
 Out of all 947 cases reported during the years 2002 - 2018, the most belonged to the categories: Rescue & EMS (32.6%), Fire (23.0%), and Overpressure Rupture (20.0%).
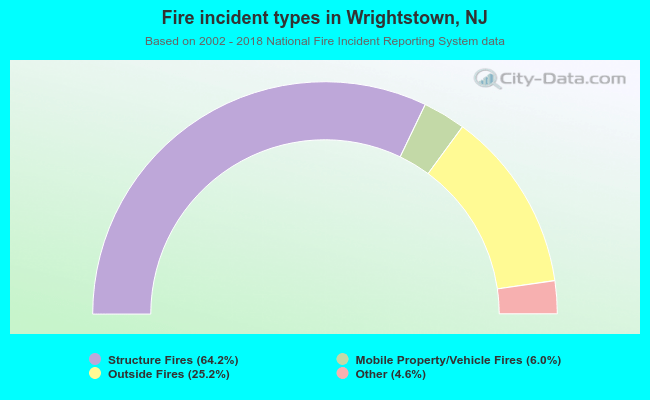 When looking into fire subcategories, the most reports belonged to: Structure Fires (64.2%), and Outside Fires (25.2%).