| Fire incidents reported |
|---|
| Sreet name | Count |
|---|
| MAIN ST | 32 | | BIG OAK RD | 24 | | STONY HILL RD | 24 | | OXFORD VALLEY RD | 14 | | TOWNSHIP LINE RD | 12 | | CLARK DR | 10 | | HEACOCK RD | 10 | | RIVER RD | 10 | | BREECE DR | 8 | | DERBYSHIRE RD | 8 | | EDGEWOOD RD | 8 | | HOMESTEAD DR | 8 | | SPRUCE MILL DR | 8 | | AFTON AV | 6 | | BLACK ROCK RD | 6 | | COUNTESS DR | 6 | | DICKINSON DR | 6 | | MAKEFIELD RD | 6 | | MILTON DR | 6 | | NEWTOWN YARDLEY RD | 6 | | PLAZA BLVD | 6 | | QUARRY RD | 6 | | RAMSEY RD | 6 | | AFTON | 4 | | AFTON AVE | 4 |
| | | Fire incidents reported |
|---|
| Sreet name | Count |
|---|
| BLUEBIRD DR | 4 | | BRIDLE ESTATES DR | 4 | | BUCK CREEK DR | 4 | | BURGUNDY PL | 4 | | CORNERSTONE DR | 4 | | DELAWARE AV | 4 | | DOVE RD | 4 | | FARMVIEW DR | 4 | | FINCH CT | 4 | | FLORAL VALE BL | 4 | | HARVARD DR | 4 | | HIGHLAND DR | 4 | | INTERSTATE 95 | 4 | | KATHY DR | 4 | | KEATING DR | 4 | | KNOLL DR | 4 | | LUDLOW RD | 4 | | LYNBROOKE DR | 4 | | MARBLE CT | 4 | | MT EYRE RD | 4 | | NOTTINGHAM DR | 4 | | PICKERING DR | 4 | | POWDER HORN DR | 4 | | QUARRY COMMONS DR | 4 | | |
|
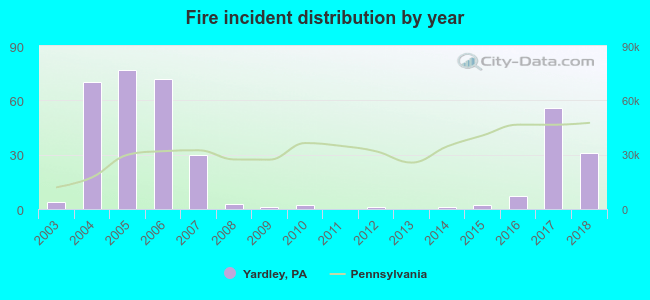 According to the data from the years 2003 - 2018 the average number of fires per year is 22. The highest number of fires - 77 took place in 2005, and the least - 0 in 2011. The data has an increasing trend.
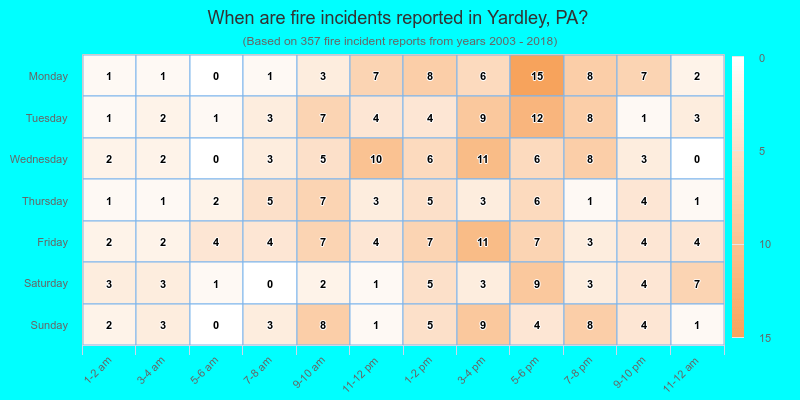
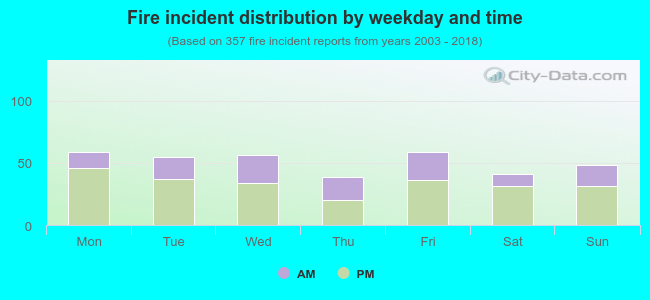 34.2% incidents where reported in the morning and 65.8% in the evening. The most fires (16.5%) took place on Monday, and the least (10.9%) on Thursday.
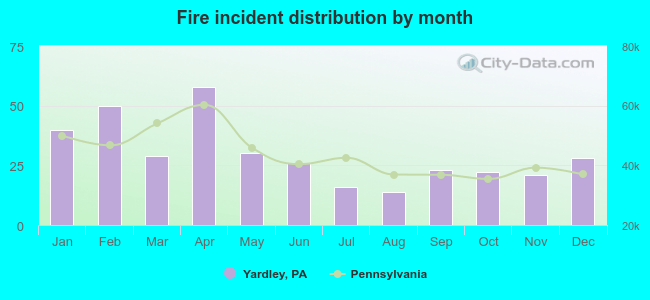 According to the 357 fire incident reports from years 2003 - 2018 most fires (16.2%) took place during April, and the least (3.9%) in August.
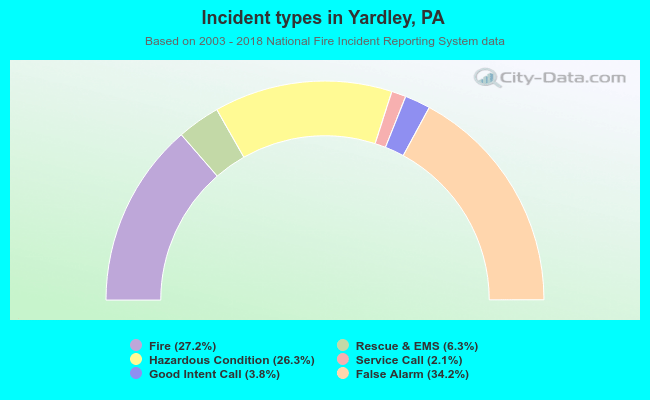 Out of all 1,311 cases reported during the years 2003 - 2018, the most belonged to the categories: Good Intent Call (34.2%), Fire (27.2%), and Rescue & EMS (26.3%).
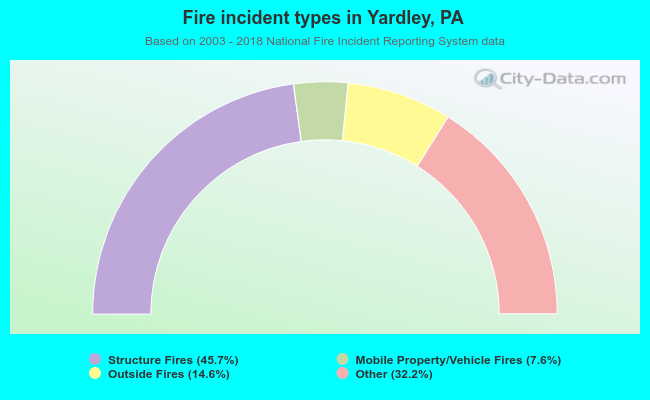 When looking into fire subcategories, the most incidents belonged to: Structure Fires (45.7%), and Other (32.2%).