Yonkers: Fire Incidents, New York (NY)
Where are fire incidents reported in Yonkers, NY
Something went wrong! Please refresh the page.
| Fire incidents reported | |
|---|---|
| Sreet name | Count |
| WARBURTON AV | 590 |
| RIVERDALE AV | 500 |
| CENTRAL PARK AV | 408 |
| HAWTHORNE AV | 366 |
| S BROADWAY | 352 |
| NEPPERHAN AV | 336 |
| KIMBALL AV | 326 |
| N BROADWAY | 324 |
| PALISADE AV | 314 |
| HUDSON ST | 298 |
| YONKERS AV | 290 |
| HIGHLAND AV | 284 |
| MCLEAN AV | 274 |
| BRONX RIVER RD | 272 |
| PARK AV | 260 |
| MEAD WY | 204 |
| VAN CORTLANDT PARK AV | 200 |
| MIDLAND AV | 198 |
| HERRIOT ST | 194 |
| ASHBURTON AV | 176 |
| WALSH RD | 172 |
| CARYL AV | 168 |
| MAIN ST | 160 |
| WILLOW ST | 160 |
| RAVINE AV | 156 |
| SCHOOL ST | 152 |
| LOCUST HILL AV | 150 |
| TUCKAHOE RD | 146 |
| MALL WK | 132 |
| VARK ST | 128 |
| Other | 2,609 |
2003 - 2018 National Fire Incident Reporting System (NFIRS) incidents
- Incident types reported to NFIRS in Yonkers, NY
- 44,49450.9%Rescue & EMS
- 17,61820.2%Hazardous Condition
- 10,29911.8%Fire
- 9,01510.3%False Alarm
- 3,1713.6%Service Call
- 2,4292.8%Good Intent Call
- 2830.3%Special Incident
- Fire incident types reported to NFIRS in Yonkers, NY
- 8,10778.7%Structure Fires
- 1,34613.1%Outside Fires
- 6476.3%Mobile Property/Vehicle Fires
- 1991.9%Other
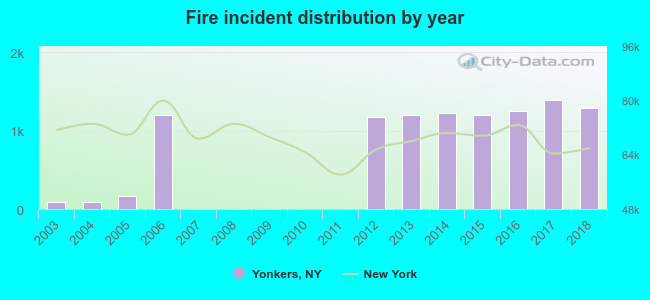 Based on the data from the years 2003 - 2018 the average number of fire incidents per year is 644. The highest number of fires - 1,387 took place in 2017, and the least - 0 in 2008. The data has a rising trend.
The average number of yearly fire incidents per 10k residents in Yonkers, NY compared to nearest cities:
(Note: Based on data for the last 3 years, including only cities with population 5,000 and above)
| Yonkers: | 65.3 |
| Bronxville: | 42.1 |
| Tuckahoe: | 45.8 |
| Mount Vernon: | 37.5 |
| Eastchester: | 27.6 |
| Pelham: | 37.0 |
| New Rochelle: | 75.2 |
| Pelham Manor: | 26.9 |
| Dobbs Ferry: | 33.6 |
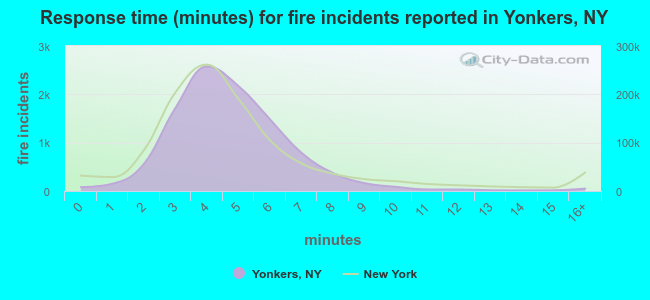 The median response time based on all reported fire incidents is 5 minutes. This is higher than the New York median value.
The median response time in Yonkers, NY compared to nearest cities:
(Note: Based on data for all years, including only cities with at least 500 fire incidents)
| Yonkers: | 5 minutes |
| Mount Vernon: | 4 minutes |
| Eastchester: | 5 minutes |
| New Rochelle: | 6 minutes |
| Dobbs Ferry: | 3 minutes |
| Scarsdale: | 4 minutes |
| Larchmont: | 2 minutes |
| Greenburgh: | 6 minutes |
| Hartsdale: | 4 minutes |
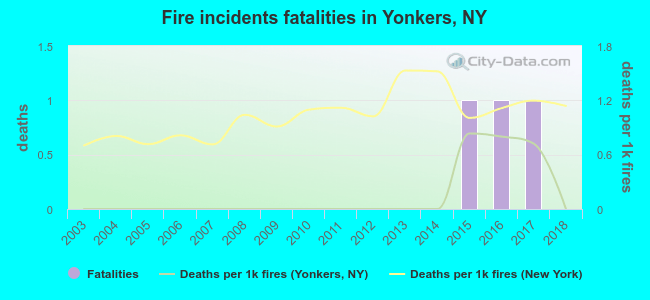 According to the reports from the years 2003 - 2018 the average number of fire-related fatalities per year is 0. The highest number of deaths - 1 took place in 2015, and the lowest - 0 in 2003. The data has a constant trend.
The average number of fatalities per 1,000 fire incidents is 0. This indicator was the highest - 1 in 2015, and the lowest 0 in 2003. The trend for deaths per 1,000 fires is constant. Compared to the New York value the number of fatalities per 1,000 incidents is much lower.
According to the reports from the years 2003 - 2018 the average number of fire-related fatalities per year is 0. The highest number of deaths - 1 took place in 2015, and the lowest - 0 in 2003. The data has a constant trend.
The average number of fatalities per 1,000 fire incidents is 0. This indicator was the highest - 1 in 2015, and the lowest 0 in 2003. The trend for deaths per 1,000 fires is constant. Compared to the New York value the number of fatalities per 1,000 incidents is much lower.Deaths per 1,000 incidents in Yonkers, NY compared to nearest cities:
(Note: Based on data for all years, including only cities with at least 2,500 fire incidents)
| Yonkers: | 0.3 |
| Mount Vernon: | 2.8 |
| New Rochelle: | 1.0 |
| Englewood: | 1.1 |
| White Plains: | 0.0 |
| Teaneck: | 3.5 |
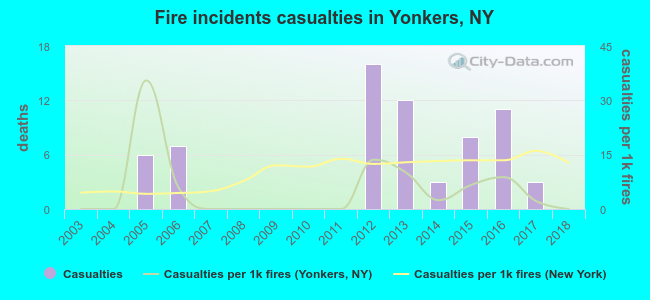 According to the data from the years 2003 - 2018 the average number of fire-related casualties per year is 4. The highest number of reported injuries - 16 took place in 2012, and the lowest - 0 in 2003. The data has a constant trend.
The average number of injuries per 1,000 fire incidents is 5. This indicator was the highest - 36 in 2005, and the lowest 0 in 2003. The trend for injuries per 1,000 fire incidents is constant. Compared to the state value the number of casualties per 1,000 fire incidents is lower.
According to the data from the years 2003 - 2018 the average number of fire-related casualties per year is 4. The highest number of reported injuries - 16 took place in 2012, and the lowest - 0 in 2003. The data has a constant trend.
The average number of injuries per 1,000 fire incidents is 5. This indicator was the highest - 36 in 2005, and the lowest 0 in 2003. The trend for injuries per 1,000 fire incidents is constant. Compared to the state value the number of casualties per 1,000 fire incidents is lower.Casualties per 1,000 incidents in Yonkers, NY compared to nearest cities:
(Note: Based on data for all years, including only cities with at least 500 fire incidents)
| Yonkers: | 6.4 |
| Mount Vernon: | 9.7 |
| Eastchester: | 11.6 |
| New Rochelle: | 2.0 |
| Dobbs Ferry: | 1.9 |
| Scarsdale: | 5.5 |
| Larchmont: | 8.9 |
| Greenburgh: | 1.3 |
| Hartsdale: | 15.9 |
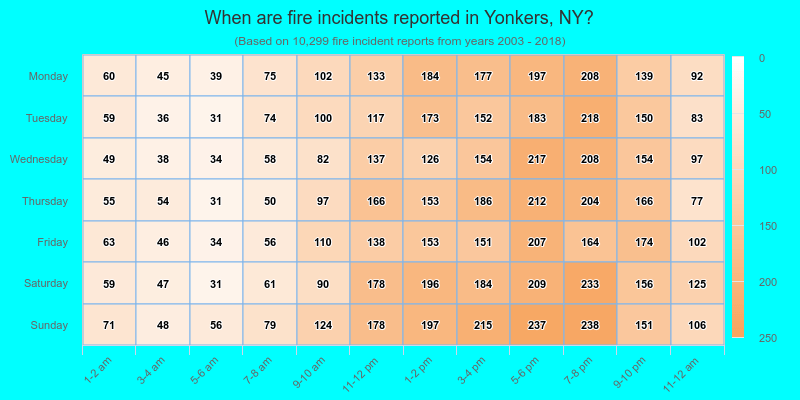
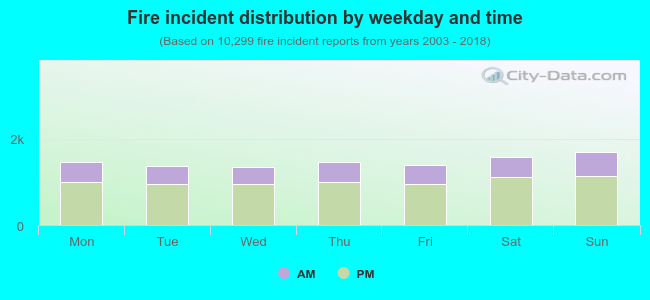 31.0% incidents where reported in the morning and 69.0% in the evening. The most fires (16.5%) took place on Sunday, and the least (13.1%) on Wednesday.
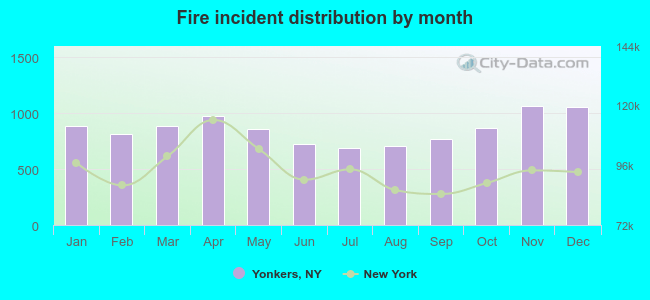 According to the 10,299 fire incident reports from years 2003 - 2018 most fires (10.4%) took place during November, and the least (6.7%) in July.
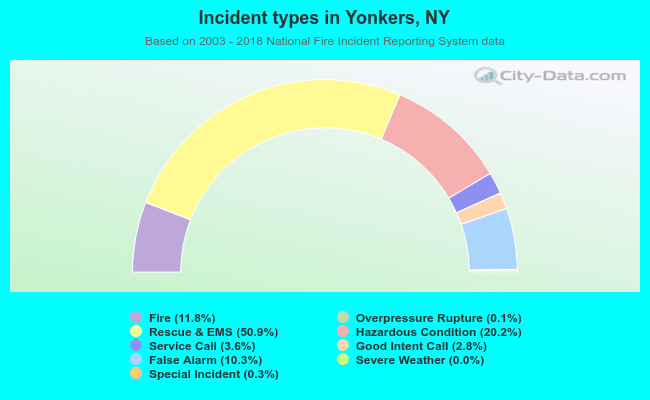 Out of all 87,420 cases reported during the years 2003 - 2018, the most belonged to the categories: Rescue & EMS (50.9%), Hazardous Condition (20.2%), and Fire (11.8%).
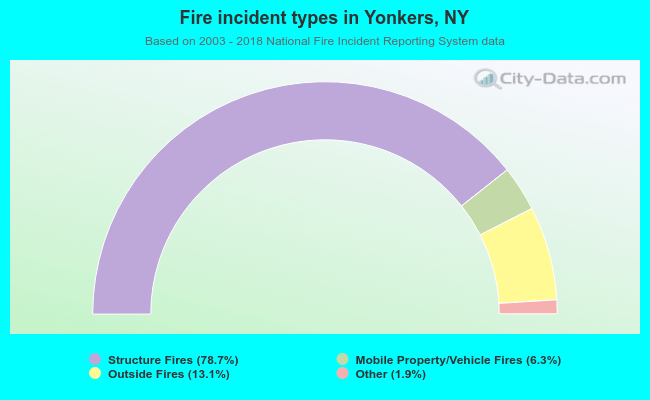 When looking into fire subcategories, the most incidents belonged to: Structure Fires (78.7%), and Outside Fires (13.1%).