Yucaipa: Fire Incidents, California (CA)
Where are fire incidents reported in Yucaipa, CA
Something went wrong! Please refresh the page.
|
| |||||||||||||||||||||||||||||||||||||||||||||||||||||||||||||||||||||||||||||||||||||||||||||||||||||||||||||
2005 - 2018 National Fire Incident Reporting System (NFIRS) incidents
- Incident types reported to NFIRS in Yucaipa, CA
- 26333.5%Good Intent Call
- 23830.4%Fire
- 18023.0%Rescue & EMS
- 708.9%Hazardous Condition
- 192.4%False Alarm
- 121.5%Service Call
- 20.3%Overpressure Rupture
- Fire incident types reported to NFIRS in Yucaipa, CA
- 11749.2%Outside Fires
- 5221.8%Mobile Property/Vehicle Fires
- 4518.9%Structure Fires
- 2410.1%Other
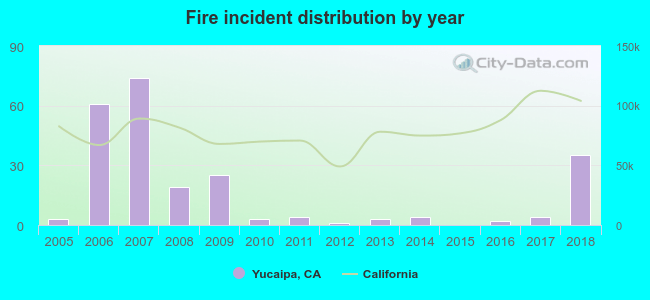 According to the data from the years 2005 - 2018 the average number of fire incidents per year is 17. The highest number of fires - 74 took place in 2007, and the least - 0 in 2015. The data has a growing trend.
The average number of yearly fire incidents per 10k residents in Yucaipa, CA compared to nearest cities:
(Note: Based on data for the last 3 years, including only cities with population 5,000 and above)
| Yucaipa: | 2.6 |
| Calimesa: | 15.8 |
| Mentone: | 16.8 |
| Cherry Valley: | 6.3 |
| Redlands: | 34.5 |
| Beaumont: | 5.4 |
| Highland: | 2.4 |
| Banning: | 12.8 |
| Loma Linda: | 30.9 |

 34.0% incidents where reported in the morning and 66.0% in the evening. The most fires (21.0%) took place on Monday, and the least (10.5%) on Sunday.
 Based on the 238 fires from years 2005 - 2018 most fires (13.0%) took place during December, and the least (4.6%) in October.
 Out of all 784 cases reported during the years 2005 - 2018, the most belonged to the categories: Good Intent Call (33.5%), Fire (30.4%), and Rescue & EMS (23.0%).
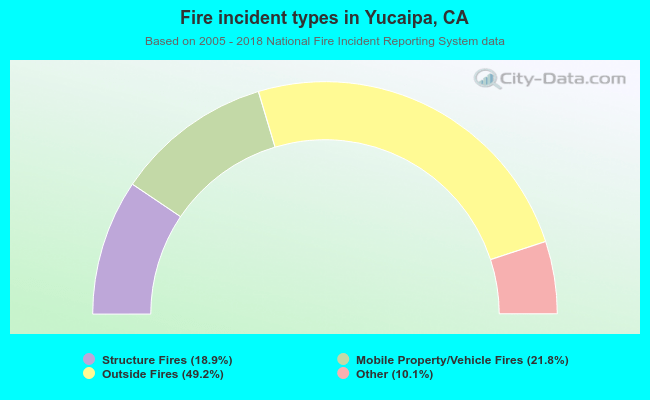 When looking into fire subcategories, the most reports belonged to: Outside Fires (49.2%), and Mobile Property/Vehicle Fires (21.8%).