Quote:
Originally Posted by rogerbacon

Next time post this line first so I can ignore you as you clearly don't know anything about economics and have bought in to the lefty argument that reducing taxes somehow reduces revenue. Everytime taxes have been reduced it has increased the revenue that government takes in. The idea that tax cuts have to someohow be 'baid for' if Democrat-spun propaganda. Learn from history.
|
Instead of asserting that because my opinion differs from yours " I must not know anything about economics," let's test your theory that " every time taxes have been reduced it has increased the revenue that government takes in." By now, after the Reagan tax-cut of 1982 (and the 1983 increase because revenue dropped in 1982) plus the Bush tax-cuts, we have plenty of data to evaluate.
Quote:
Since World War II, federal tax receipts have fluctuated within a few points of 18 percent of the Gross Domestic Product. Because they have been so stable, tax collections have regularly grown with the economy. Almost always, the only drops in tax collections have been during recession years; otherwise, tax collections have expanded in the years that the rest of the economy expanded.
There are a few notable exceptions to the above rule: those periods following large tax cuts. After Reagan's income tax cuts took effect in 1982, real income tax collections took a long fall, despite the fact our economy continued to grow. For the moment, let's ignore the fact that tax collections could have been expected to grow after 1981. Let's simply use 1981 as a baseline, multiplying it 8 times, and compare that to what was really collected over the next 8 years.
Individual Income Tax Collections (millions) (1)
Year Current Constant (87 dollars)
-------------------------------------------
1981 $285,917 $367,692
1982 297,744 356,366
1983 288,938 332,033
1984 298,415 328,470
1985 334,531 354,677
1986 348,959 359,307
1987 392,557 392,557
1988 401,181 387,128
1989 445,690 411,533
-----------------------------
82-89 total: 2,922,691
1981 (times 8) -2,941,536
-----------------------------
Net 8-year loss -18,845
Corporate Income Taxes (millions)
Year Current Constant (87 dollars)
-------------------------------------------
1981 $61,137 $78,623
1982 49,207 58,991
1983 37,022 42,544
1984 56,893 62,623
1985 61,331 65,024
1986 63,143 65,015
1987 83,926 83,926
1988 94,508 91,224
1989 103,291 98,092
------------------------------
82-89 total: 567,439
1981 (times 8) -628,984
------------------------------
Net 8-year loss -69,545
...
The simple fact is that there was a 5 year drop in tax collections, which was extremely uncharacteristic of a growing economy.
(source)
|
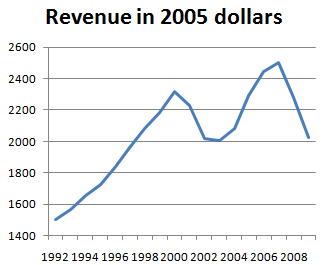
Clinton raised taxes in 1992 and there was steady growth until Bush cut taxes in 2001, at which time revenue collapsed. It took the housing bubble for revenues to recover. Nevertheless, it took until 2005, with an increase in population, for revenues to recover just to 2000 levels -- let alone the increase in revenue that supply siders boast should happen.
Here's another chart:
 In short, the notion that tax cuts increase government revenues has no empirical support. It's what we call a zombie lie -- no matter how many times this lie is shot down, it gets up to be repeated.
 It's a ludicrous theory that implies that if we cut taxes to zero, the government would have unlimited revenue. It's clear to see why it does not work. If tax-rates are cut from 30% to 15%, economic activity would need to double in order for government revenues just to be equal.
Quote:
Update: For the econowonks out there: business cycles are an issue here — revenue growth from trough to peak will look better than the reverse. Unfortunately, business cycles don’t correspond to administrations. But looking at revenue changes peak to peak is still revealing. So here’s the annual rate of growth of real revenue per capita over some cycles:
1973-1979: 2.7%
1979-1990: 1.8%
1990-2000: 3.2%
2000-2007 (probable peak): approximately zero
Do you see the revenue booms from the Reagan and Bush tax cuts? Me neither. (source)
|
The theory is busted and I would contend that it is not me who is short on macro economics knowledge, pal. My 3rd grade teacher, Mrs. Goodman, was right. Those that know the least are first to use insults to hide their shortcomings.
Last edited by MTAtech; 05-05-2011 at 04:48 PM..
|