Please register to participate in our discussions with 2 million other members - it's free and quick! Some forums can only be seen by registered members. After you create your account, you'll be able to customize options and access all our 15,000 new posts/day with fewer ads.
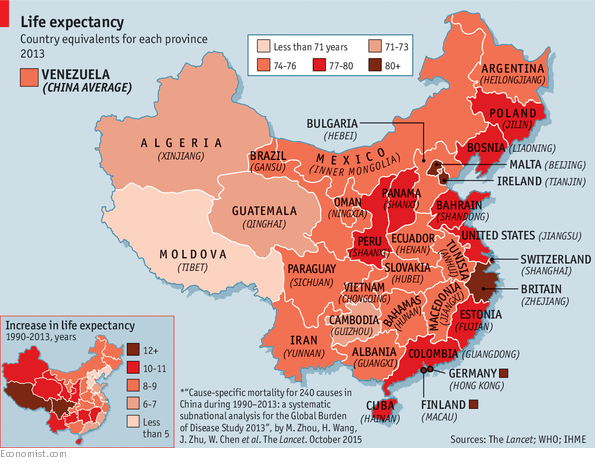
A new study published in the Lancet for the first time offers a province-by-province breakdown of China’s health. The map displays life expectancy at birth for each of the 33 provincial-level regions, matched with the country that is most similar by this measure.
The study shows that a baby born in China in 1990 would live on average to the age of 68. One born in 2013 could expect to reach 76, beyond the age at which Confucius said “one can follow one’s heart’s desires—without crossing the line.” There is a large disparity between provinces, but the gap is narrowing. In Shanghai life expectancy is now 83—as good as Switzerland. People in six areas live longer than Americans. The most impressive progress has taken place in the most benighted regions: a child in Tibet born in 1990 had a life expectancy of 56, akin to one of the poorest African countries. This has risen to 70, roughly the same as Moldova, one of Europe’s poorer countries.
6 areas: Shanghai, Beijing, Tianjin, Zhejiang, Hong Kong, Macau
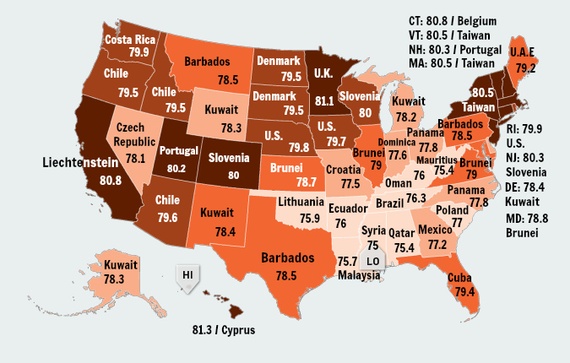
For an accurate comparison you need to compare apples to apples; race impacts life expectancy. There are at least six states in the United States where the average life expectancy of Asians is over 89, with an average of 86.5 years for Asians in the country as a whole. There are isolated cities where it is even higher.
__________________
When I post in bold red that is moderator action and, per the TOS, can only be discussed through Direct Message.
For an accurate comparison you need to compare apples to apples; race impacts life expectancy. There are at least six states in the United States where the average life expectancy of Asians is over 89, with an average of 86.5 years for Asians in the country as a whole. There are isolated cities where it is even higher.
Alcoholism and violent crime bring down the number in certain demographics.
For an accurate comparison you need to compare apples to apples; race impacts life expectancy. There are at least six states in the United States where the average life expectancy of Asians is over 89, with an average of 86.5 years for Asians in the country as a whole. There are isolated cities where it is even higher.
Asians in America tend to be in certain categories: restaurant staff, store keepers, engineers, accountants, ....
But in China they are much more likely to be farmers, policemen, athletes, factory workers, musicians...and those careers are often associated with shorter life spans too. So there is never a fair comparison.
A new study published in the Lancet for the first time offers a province-by-province breakdown of China’s health. The map displays life expectancy at birth for each of the 33 provincial-level regions, matched with the country that is most similar by this measure.
The study shows that a baby born in China in 1990 would live on average to the age of 68. One born in 2013 could expect to reach 76, beyond the age at which Confucius said “one can follow one’s heart’s desires—without crossing the line.” There is a large disparity between provinces, but the gap is narrowing. In Shanghai life expectancy is now 83—as good as Switzerland. People in six areas live longer than Americans. The most impressive progress has taken place in the most benighted regions: a child in Tibet born in 1990 had a life expectancy of 56, akin to one of the poorest African countries. This has risen to 70, roughly the same as Moldova, one of Europe’s poorer countries.
6 areas: Shanghai, Beijing, Tianjin, Zhejiang, Hong Kong, Macau
I don't think a Tibetan government headed by a theoretic council of monks could achieve what was done for Tibet. Seventy years is a long life, especially given Tibet's very limited material resources.
Please register to post and access all features of our very popular forum. It is free and quick. Over $68,000 in prizes has already been given out to active posters on our forum. Additional giveaways are planned.
Detailed information about all U.S. cities, counties, and zip codes on our site: City-data.com.

 Please register to participate in our discussions with 2 million other members - it's free and quick! Some forums can only be seen by registered members. After you create your account, you'll be able to customize options and access all our 15,000 new posts/day with fewer ads.