Please register to participate in our discussions with 2 million other members - it's free and quick! Some forums can only be seen by registered members. After you create your account, you'll be able to customize options and access all our 15,000 new posts/day with fewer ads.
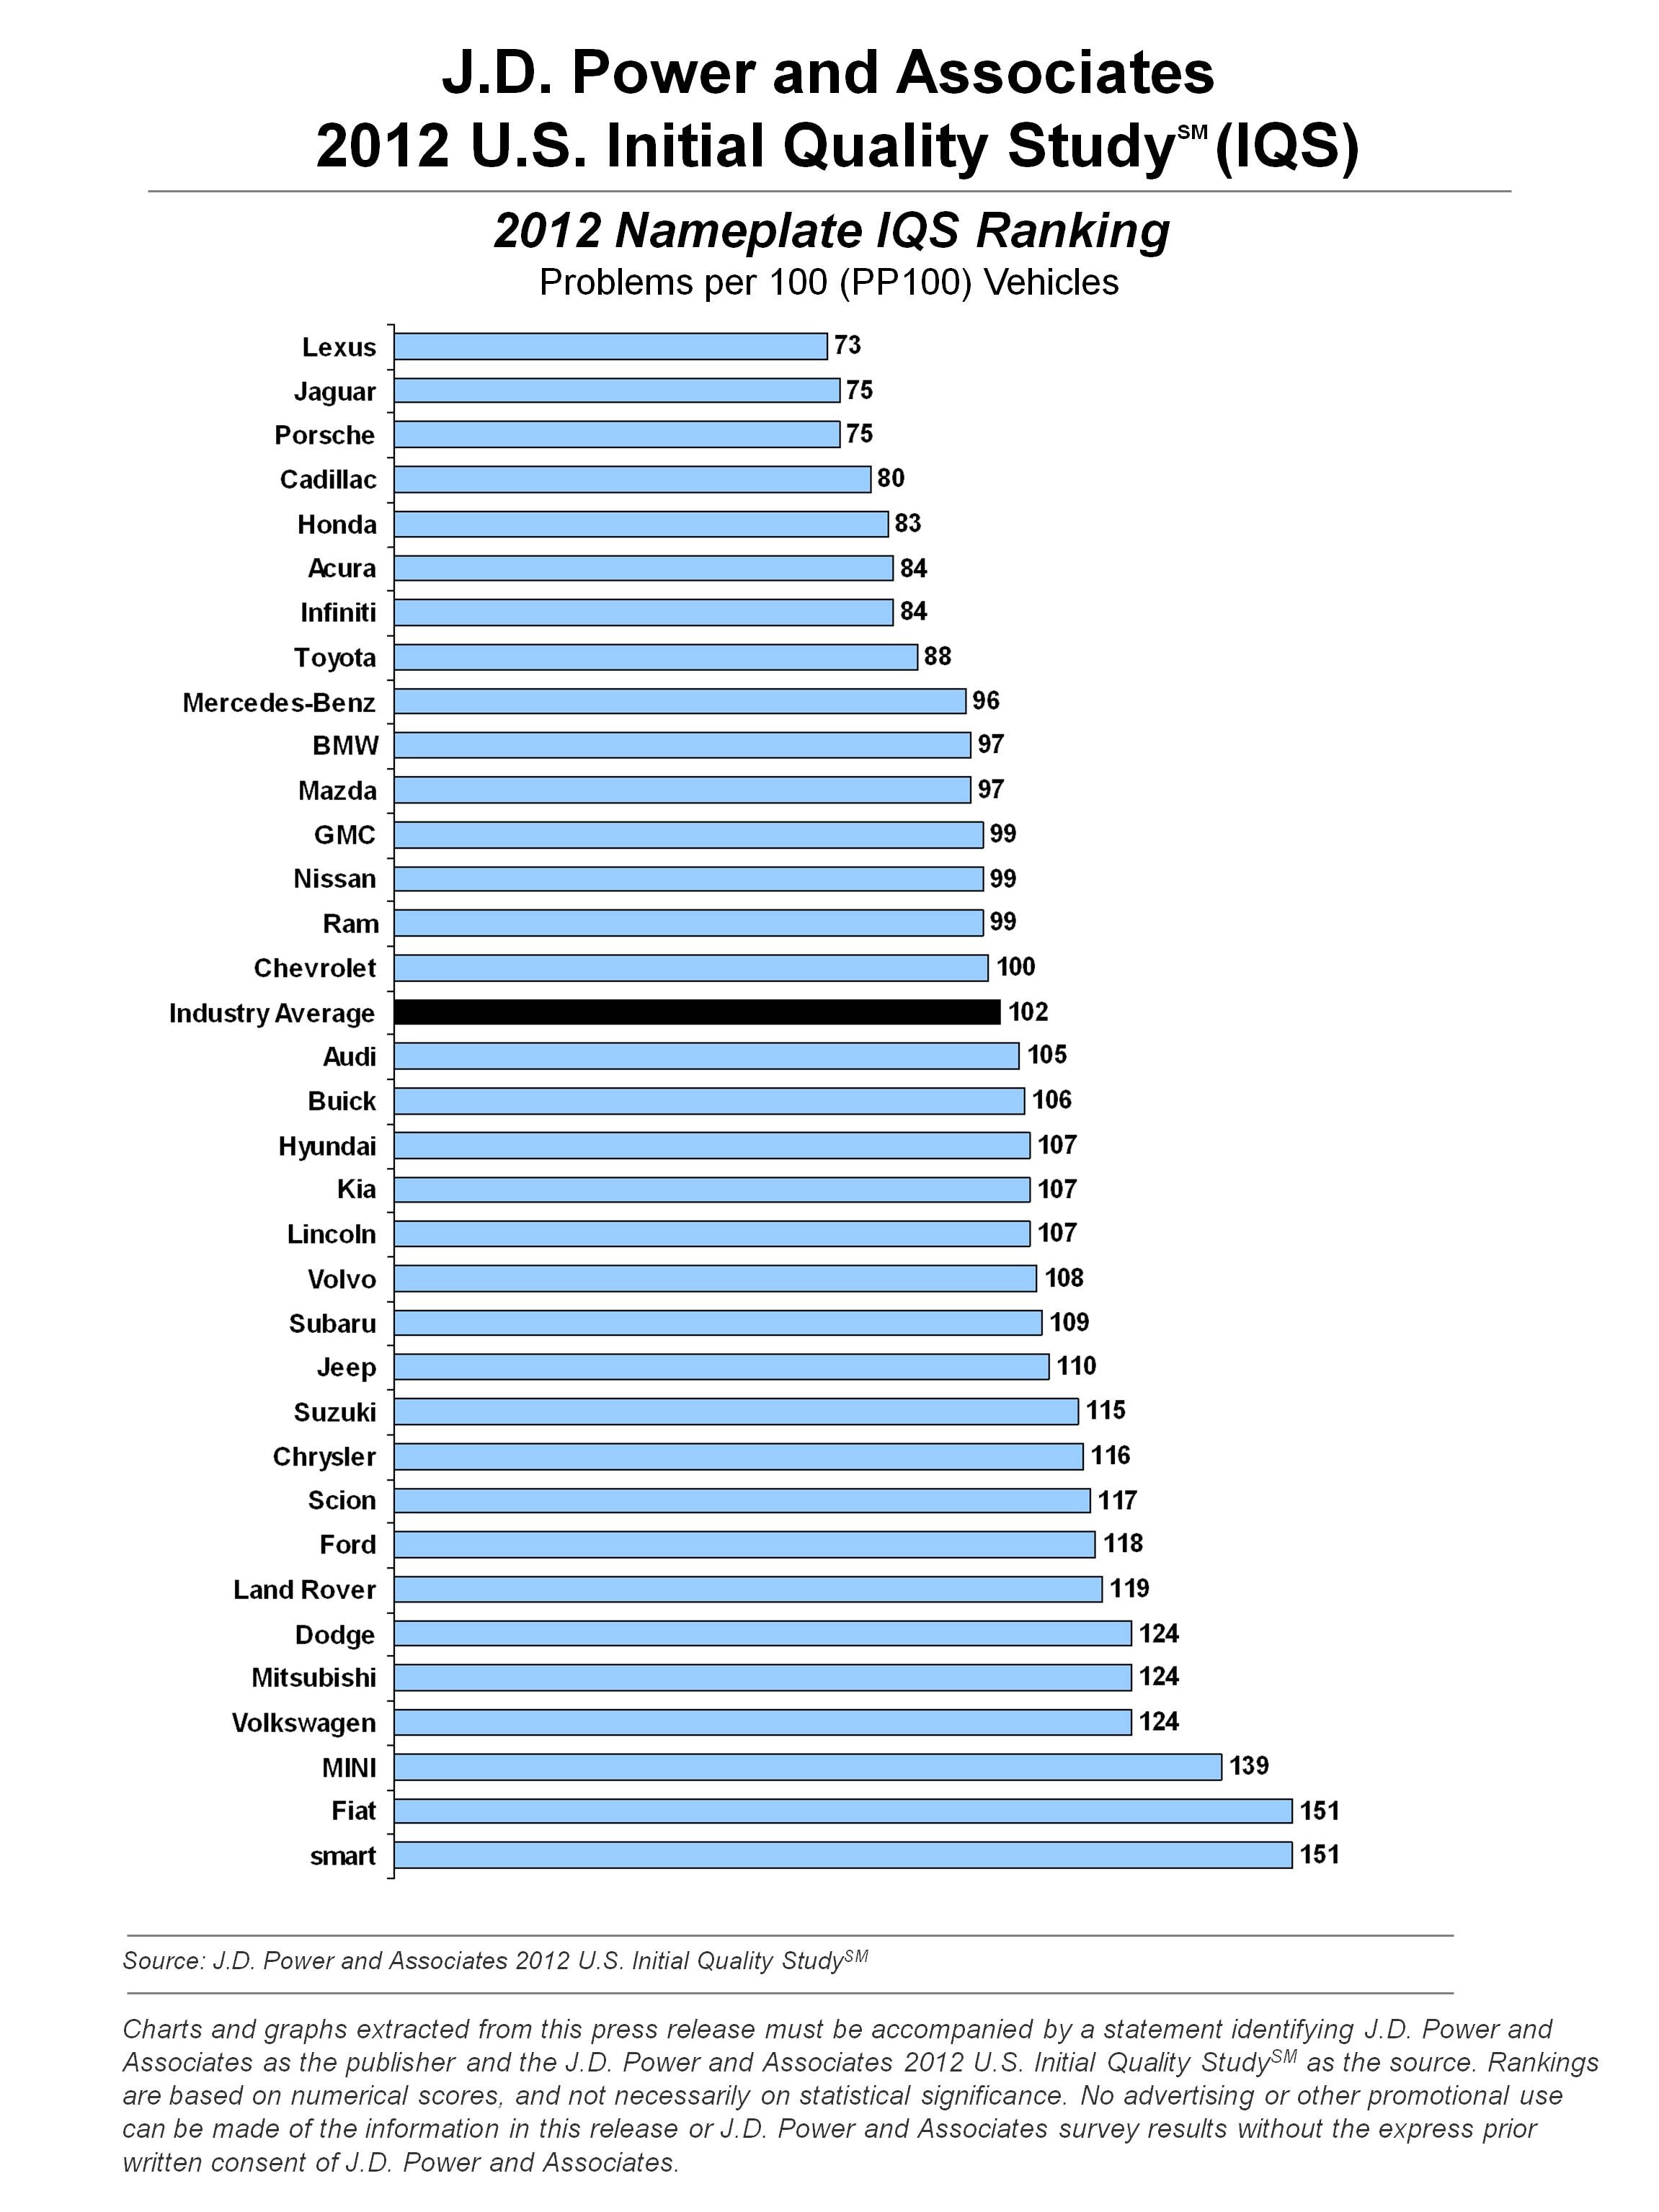
Here it is folks. To me this is not surprising. With all the bashing of Honda and Toyota they still rank highest among non Luxury, while both of their Luxury brands rank in the top 10. The top 10 overall does looks about right imo.
No surprise especially after owning a new one that Ford is near the bottom, while Korean brands fell below the industry average.
I consider it worthless information. The questionnaire will almost beat a new car buyer home. Every new car/truck I've bought the questionnaire was at the house in 3 days. Give me a break, I'm learning how to turn on the headlights and you want to know if I'm happy spending way too much for far too little? Jeez, people never get the opportunity to hate the thing or love it. And considering that the folks that spent the big bucks, do you really think they're going to hate it and say to Power,"Hey, I'm a moron for buying this car and spending this much money". Absolutely worthless info. If they sent the paper out after 30 days after ownership, then it would have credibility but not as it is.
I consider it worthless information. The questionnaire will almost beat a new car buyer home. Every new car/truck I've bought the questionnaire was at the house in 3 days. Give me a break, I'm learning how to turn on the headlights and you want to know if I'm happy spending way too much for far too little? Jeez, people never get the opportunity to hate the thing or love it. And considering that the folks that spent the big bucks, do you really think they're going to hate it and say to Power,"Hey, I'm a moron for buying this car and spending this much money". Absolutely worthless info. If they sent the paper out after 30 days after ownership, then it would have credibility but not as it is.
I get what you're saying, and that may explain why there's a big clump of brands in the middle but doesn't explain why certain brands are consistently bottom dwellers or whose scores are out of whack with everyone else's -- Mini, VW, Mitsubishi, Land Rover. The IQS certainly doesn't tell the whole story but I think it does give you some clues.
It's surprising to me that Subaru and Hyundai are at the bottom while Mercedes Benz is above avgerage based on everything you read and hear about them from folks.... No surprise about VW! Also, with all the good things you read and hear about all the new Fords, I'm a bit surprised about that as well... Unless it's all related to their Sync option..
I don't even look at initial quality surveys, I look at long term reliability surveys (consumer reports). Fit and finish and quality door handles don't mean squat if the engine fails at 60k miles.
I notice Jaguar ranks near the top, but let's face it, they're well known for making junk. They should be right down there with Land Rover.
The first 90 days are not very meaningful to me. Jaguar is the clear anomaly here. It is not possible that Jaguar has suddenly improved its overall quality. It's initial quality may be high - but year after year it has never held up.
JD Power only processes about 45,000 surveys. There are 34 brands in that list. That means on average, only 1300 or so surveys per brand, and far fewer per specific model. If each brand has 15 models then there are only 88 surveys per model. It is of course much higher for the big brands, and much lower for the small brands.
It's surprising to me that Subaru and Hyundai are at the bottom while Mercedes Benz is above avgerage based on everything you read and hear about them from folks.... No surprise about VW! Also, with all the good things you read and hear about all the new Fords, I'm a bit surprised about that as well... Unless it's all related to their Sync option..
It is. This study has been discussed several times and the primary reason Ford fell so much was do to issues with the Sync system. The thing you need to remember about these studies is that any single year is pretty much meaningless, it is the aggregate years where you really start to notice some trends. Also, the IQS is very much tainted by new owner experience and is only based on 90 days of ownership. They also consider "problems" to be anything from complaints about the size of radio knobs to engines failing and all are counted the same. For the most part, the IQS is populated by people complaining about fit and finish and issues with features. Also, the study posted is the one that shows everything lumped together. If you go to the JD Power site they have another version that separately ranks "new and redesigned" models. This is because historically, new and redesigned cars perform the worst on these studies, so the "fresher" a model range is the worst it performs on the tests. This is why brands like Buick and Lincoln that used to be perennial top 5 on these lists fell so far, they are actually releasing new product. Basically, the rankings punish innovation.
The more telling tale is the VDS or Vehicle Dependability Study. This is performed at the 3 year ownership mark and accounts for the long term reliability and issues with the vehicles. While there is a strong correlation between the IQS and VDS, this is because new models tend to perform worse in terms of long term reliability. The best way to look at JD Power, IMO, is to look at composite data from the VDS over several years and rank the brands on average. I did this in another thread, but it is worth reposting here.
The following is a list of the current 34 measured brands inJD Power, with the industry average ranked as well, so 35 total places. This is a composite average of the past 5 years of dependability studies. What that means is the average 3 year performance of all cars built from 2005-2009, measured in problems per 100 vehicles. Consider this "dependability consistency":
You can do the same thing for the IQS, but the results fluctuate greatly depending on introduction of new models. If one is talking about reliability by brand for comparison purposes, I think the better way to do it is over time and using the more complete VDS study.
Please register to post and access all features of our very popular forum. It is free and quick. Over $68,000 in prizes has already been given out to active posters on our forum. Additional giveaways are planned.
Detailed information about all U.S. cities, counties, and zip codes on our site: City-data.com.

 Please register to participate in our discussions with 2 million other members - it's free and quick! Some forums can only be seen by registered members. After you create your account, you'll be able to customize options and access all our 15,000 new posts/day with fewer ads.