Please register to participate in our discussions with 2 million other members - it's free and quick! Some forums can only be seen by registered members. After you create your account, you'll be able to customize options and access all our 15,000 new posts/day with fewer ads.
I keep seeing people arguing about densities so I tried to come up with a way of making sense of it. Hopefully I made a dent. The following map has density (people/sq.mi) on the Y-axis and area (sq.mi) on the X-axis. For a given X, the chart is "The population density of the densest X sq. mi. of the city."
Since census tracts go by county, these values are actually for the relevant counties. Just as well since adding some suburban county won't make a dent in the core density anyway. I combined the 5 counties that make up NYC. I wanted to add DC, I couldn't find census tract info for it in a table form - I'll add it if you can point it out. Looking for other suggestions - I could throw in another city in there if people are interested.
Notes:
All data from the 2010 census
The X-axis is on a logarithmic scale
In principle, the "densest X sq.mi." might not be contiguous, but in practice the densest parts of a county are usually close to one another if not touching.
There's some bumpiness from round-off errors. The actual trend should be consistent decline.
problem with this is that in some counties ares just the core (SF, Philly) or part of the core (NY) while others the county includes multiple cities (Harris, LA, etc)
I keep seeing people arguing about densities so I tried to come up with a way of making sense of it. Hopefully I made a dent. The following map has density (people/sq.mi) on the Y-axis and area (sq.mi) on the X-axis. For a given X, the chart is "The population density of the densest X sq. mi. of the city."
Since census tracts go by county, these values are actually for the relevant counties. Just as well since adding some suburban county won't make a dent in the core density anyway. I combined the 5 counties that make up NYC. I wanted to add DC, I couldn't find census tract info for it in a table form - I'll add it if you can point it out. Looking for other suggestions - I could throw in another city in there if people are interested.
Notes:
All data from the 2010 census
The X-axis is on a logarithmic scale
In principle, the "densest X sq.mi." might not be contiguous, but in practice the densest parts of a county are usually close to one another if not touching.
There's some bumpiness from round-off errors. The actual trend should be consistent decline.
NEI posted graphs that are very similar to these on the urban planning forum.
NYC is obviously the most urban, dense city in the country. Followed by SF, Chicago and LA. The next tier is Philly and Boston.
The graph is slightly hard to interpret because it covers such a broad range.
Houston has a census tract over 50k ppsm? Where is that?
problem with this is that in some counties ares just the core (SF, Philly) or part of the core (NY) while others the county includes multiple cities (Harris, LA, etc)
Yeah - if only there was some consistency behind what it takes to be a county. Still, the core few sq.mi won't change unless a neighboring county somehow has a hyperdense census tract. To demonstrate, I did the same chart as above except I added all of Middlesex county to Boston's profile. The core basically doesn't budge, but the tail gets longer and higher:
Quote:
Originally Posted by munchitup
Houston has a census tract over 50k ppsm? Where is that?
I have it as tract 4214.02, west of West University Place (pdf).
Yeah - if only there was some consistency behind what it takes to be a county. Still, the core few sq.mi won't change unless a neighboring county somehow has a hyperdense census tract. To demonstrate, I did the same chart as above except I added all of Middlesex county to Boston's profile. The core basically doesn't budge, but the tail gets longer and higher:
I have it as tract 4214.02, west of West University Place (pdf).
Odd. Would have thought it would be Greenway. It has its own zip code and because it is small it has a much higher density than Gulfton. I guess the census tracks in Gulton broke up the area while that in Greenway added lower density area
Since census tracts go by county, these values are actually for the relevant counties
Maybe I've misunderstood, but are you comparing the population density of 4,060 sq. mile Los Angeles county (much of which is uninhabited mountains and desert) with 46 sq mile San Francisco county (which is all the city of San Francisco)?
Or am I interpreting your statement incorrectly?
Land areas of the counties (sq. miles):
Maricopa: 9,203
Los Angeles: 4,060
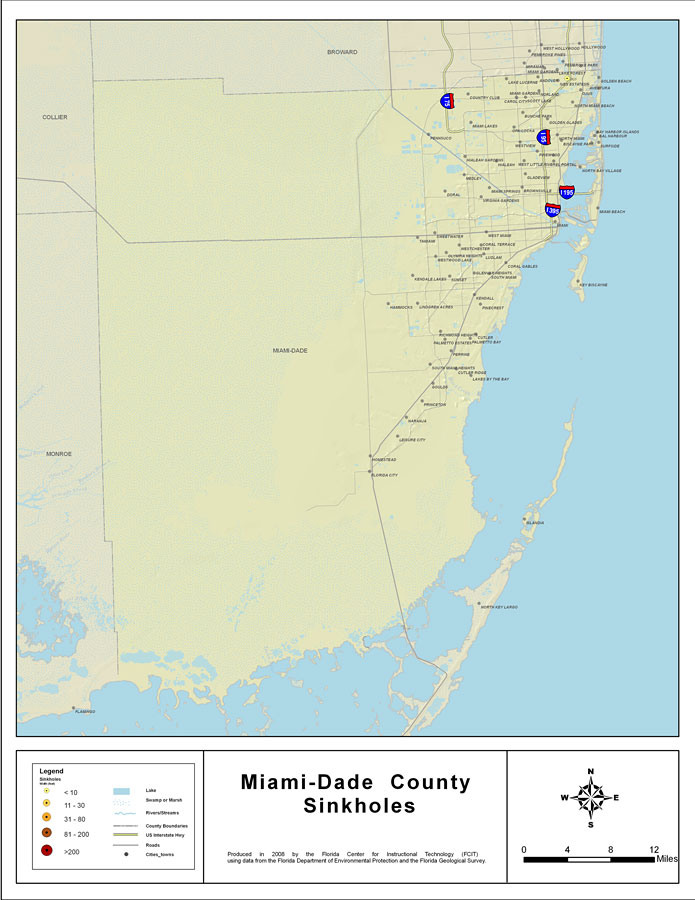
Miami-Dade: 1,898
Harris (Houston): 1,729
Cook: 946
New York: 303
Philadelphia: 135
Suffolk (Boston): 59
San Francisco: 46
Problem with Miami-Dade is most of it is uninhabitable land
Why is that a problem? Wouldn't that act as a barrier to sprawl and tend to make the habitable parts more dense?
Please register to post and access all features of our very popular forum. It is free and quick. Over $68,000 in prizes has already been given out to active posters on our forum. Additional giveaways are planned.
Detailed information about all U.S. cities, counties, and zip codes on our site: City-data.com.

 Please register to participate in our discussions with 2 million other members - it's free and quick! Some forums can only be seen by registered members. After you create your account, you'll be able to customize options and access all our 15,000 new posts/day with fewer ads.