06-15-2013, 02:04 AM
Location: CO/UT/AZ/NM Catch me if you can!
6,926 posts, read
6,931,897 times
Reputation: 16509
As we all know, Colorado is the most beautiful state of all of them in the Union. It's why we Coloradoans stick it out through bad fire seasons, the truck that jack-knifes on Vail Pass closing it down for 3 hours at least a 100 times every winter, and a bizarre state government (one of my favorite pass times is sending outraged e-mails to every single member of the Colorado State Legislature - much good it does me).
I poke fun at the Four Corners region - especially Cortez, but actually, I get to live in the very best part of Colorado of all. And believe me I know, having grown up in the Springs, partied my way through the University of Colorado in Boulder, landed a great job in Denver but couldn't stop rambling. So one day I drove over Wolf Creek, hit Durango and knew immediently that I'd found MY place in the world.
I was born to travel, and I've been all over this wonderful state, but the Four Corners always owns this Rambler's heart. How lucky am I! The San Juan Mountains are my backyard and I have a beat up old Toyota to lock in the hubs on, take to the back roads and vanish. I got off to a late start this year, but the West Fork of the Dolores has been waiting patiently for me all the same.
Take Highway 145 out of Cortez, go through the town of Dolores, and continue on along the Dolores River to the cut-off for the West Fork and the town of Dunton. Big Up Country starts here! The back country traveler has the choice of continuing on past Dunton to the Forest Service Campgrounds on the West Dolores or else just look for a promising old logging road and see where it goes. I prefer the logging roads, myself. I always carry the latest copy of the very best adventure book ever published - the Colorado Atlas and Gazetteer, Detailed Topographic Maps - available at the Giant convenience store in Dolores or any number of other gas stations and pit stops throughout the state.
My ancient Toyota wouldn't know what to make of those fancy GPS systems that come equipped on new cars and trucks, so I carry an old orienteering GPS that I bought at a pawn shop outside of Cortez. With that GPS and the Gazetteer of enchantment, I can get lost for days if I want, and I want! My Toyota was made for journeys and has a 20 gallon gas tank, the aforementioned hop-out of the truck and lock in the 4wd hubs, and a camper shell where I keep 15 to 20 gallons of water, a Coleman lantern and tent, plus a bottle of insect repellent. What more does a gal need when checking out her backyard?
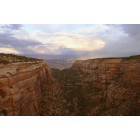
Here's some pix of my first camp of the summer.
Summer camp and my old truck
View to the North of camp
Mount Wilson as seen from the road between Dunton and Rico
Road up to camp
06-15-2013, 08:50 AM
3,490 posts, read
6,096,821 times
Reputation: 5421
"You must spread some reputation around before giving it to Colorado Rambler again."
06-15-2013, 10:31 AM
Location: CO/UT/AZ/NM Catch me if you can!
6,926 posts, read
6,931,897 times
Reputation: 16509
Last edited by Mike from back east; 06-15-2013 at 12:14 PM ..
Reason: Aligning captions
06-15-2013, 11:20 AM
2,253 posts, read
6,984,029 times
Reputation: 2654
But, of course, camping
Appears a lovely campsite, and fine way to spend some quality time in Colorado.
06-15-2013, 11:23 AM
Location: CO
2,886 posts, read
7,132,082 times
Reputation: 3988
Now that's a site that takes one's breath away. . .
06-15-2013, 02:55 PM
Location: CO/UT/AZ/NM Catch me if you can!
6,926 posts, read
6,931,897 times
Reputation: 16509
Quote:
Originally Posted by
Idunn
Appears a lovely campsite, and fine way to spend some quality time in Colorado.
I wish. At higher elevations like where I camped, things don't seem to be too bad on the western side of the San Juans. The trees in the pictures above are pretty representative of what you'll see between Cortez and Telluride. There's more dead standing aspen over the past few years. You can see them in the pictures if you look closely. Still the montane to sub-alpine forests around here seem to be holding their own. I've haven't looked at them with a critical eye, however, so I may be wrong.
The Uncompahgre Plateau is a write off. The trees there are just waiting for the right lightening strike for the entire plateau to be engulfed in a crown fire. The northern sector is the worst. There's pine beetle, dead standing trees and lots of dead underbrush. It doesn't help that the Uncompahgre is mostly under BLM (mis)management, so it's been over grazed and it's covered with eroded roads and gullies thanks to Halliburton and their ilk checking out the plateau for fracking operations. I give the area a max of 10 years at most. The area between Montrose and Nucla is THAT bad. I think everyone living in Nucla should just get out - there's no jobs there anyhow since the prairie dog hunt got deep sixed some years back.
They are banning the hunting of mountain lions in the region, though. One small bright spot. Go kitties, go!
The area that is roughly bounded by the Dolores on one side and the Utah border on the other also looks bad. It's mostly P-J and the P's are dying. I still can't get over this. Hell, even the sagebrush isn't looking good and the Disappointment Valley From Egnar on north is living up to its name. The Pagosa Springs/Durango/Mancos corridor is looking pretty dry as well.
Black Canyon of the Gunnison, the trees are suffering from drought and beetle. Grand Mesa and Uncomphagre NATIONAL FOREST looked somewhat better than the BLM lands further south when I was out that way last year.
One of the reasons I call this place the "Lost Corners" is because we are fighting the drought and warming trends on all fronts. The resevoirs are drying up, price of hay through the roof, the pinto crop harvest is pathetic and getting worse each year. We have major forest fires out here every summer and Montezuma and Dolores Counties have been designated agricultural disaster areas by the USDA. Yet our plight never seems to get reported. Heck, sometimes we don't even report it to ourselves since the local paper is down to two editions a week. We don't even get proper weather forecasts since the sequester apparently has vanished the local weather reporting station. And the local cable companies treat us to news of stabbings in ABQ. We don't get any Colorado news. It's like we no longer exist out here.
Aren't you glad you asked?
06-15-2013, 09:25 PM
3,125 posts, read
5,047,057 times
Reputation: 7430
Gorgeous pictures! What camera are you using?
06-15-2013, 09:58 PM
8,317 posts, read
29,463,282 times
Reputation: 9306
I know all the areas that Rambler mentions (and showed in photos) quite well. I think that she is a little wrong about the Uncompahge Plateau, though. It still has many beautiful areas that are not well-known to outsiders, and that is good. Ironically, it is the areas of the Plateau that have not been logged that are in the worst shape as far as unhealthy forests go. Many decades of fire suppression in those areas has led to unhealthy undergrowth and tree crowding that is ripe for a crown fire. That has been the case for years. A forester on the Uncompahgre National Forest candidly told me over 20 years ago that the best thing that could happen to the west side of the Plateau would be for someone to head up there with 5 gallons of gas and a pack of matches. He followed by saying that, of course, if a fire started up there, that the Forest Service would have to go and put it out rather than letting fire cleanse the forest floor of undergrowth and overcrowded trees. Well, about a year later a fire did start on the Plateau and the same guy was up there for many days helping put it out. So, much of the forest is still an unhealthy mess.
06-16-2013, 12:02 AM
Location: CO/UT/AZ/NM Catch me if you can!
6,926 posts, read
6,931,897 times
Reputation: 16509
Quote:
Originally Posted by
mic111
Gorgeous pictures! What camera are you using?
Why, thank you. Although anyone can go to those places and get fantastic photos with a little throw away camera bought at Wally World. It's beautiful country that always photographs well. My camera is a used one sent to me by a friend who was getting himself a better one. It's a Canon Power Shot SD 790 IS that is somewhat battered after I took a fall on it during a hike across some loose rock at Canyon of the Ancients.
@Jazzlover: I don't think we're really in disagreement about the Uncompahgre Plateau. I've loved it, logging roads and all, since the very first time I forded the Uncompahgre River near Escalante and proceeded on through tall bushes of highly aromatic West Slope sage, climbing up to the top where I encountered those wonderful stands of aspen you mentioned. The Plateau is indeed a special place known mostly to back country enthusiasts who live on the Western Slope.
I write it off with sorrow, but I really can't imagine that even the more pristine areas will withstand the continued drought and insect invasions for many more years. I studied plant and forest ecology in college, and the state of the trees on the Plateau saddens me a little more each time I see them. I feel more hopeful about the San Juans, but the impact of the drought is evident everywhere.
06-16-2013, 04:22 PM
Location: Bend, OR
3,296 posts, read
9,685,665 times
Reputation: 3343
Wonderful post, Colorado Rambler! You have me missing the Western Slope again. I worked for the Forest Service on the GMUG NF's when I lived in Grand Junction, and I definitely hear you regarding the Uncompaghre Plateau. I see that you and Jazzlover are actually in agreement too.
Please register City-data.com
Data:
Median household income ($)
Median household income (% change since 2000)
Household income diversity
Ratio of average income to average house value (%)
Ratio of average income to average rent
Median household income ($) - White
Median household income ($) - Black or African American
Median household income ($) - Asian
Median household income ($) - Hispanic or Latino
Median household income ($) - American Indian and Alaska Native
Median household income ($) - Multirace
Median household income ($) - Other Race
Median household income for houses/condos with a mortgage ($)
Median household income for apartments without a mortgage ($)
Races - White alone (%)
Races - White alone (% change since 2000)
Races - Black alone (%)
Races - Black alone (% change since 2000)
Races - American Indian alone (%)
Races - American Indian alone (% change since 2000)
Races - Asian alone (%)
Races - Asian alone (% change since 2000)
Races - Hispanic (%)
Races - Hispanic (% change since 2000)
Races - Native Hawaiian and Other Pacific Islander alone (%)
Races - Native Hawaiian and Other Pacific Islander alone (% change since 2000)
Races - Two or more races (%)
Races - Two or more races (% change since 2000)
Races - Other race alone (%)
Races - Other race alone (% change since 2000)
Racial diversity
Unemployment (%)
Unemployment (% change since 2000)
Unemployment (%) - White
Unemployment (%) - Black or African American
Unemployment (%) - Asian
Unemployment (%) - Hispanic or Latino
Unemployment (%) - American Indian and Alaska Native
Unemployment (%) - Multirace
Unemployment (%) - Other Race
Population density (people per square mile)
Population - Males (%)
Population - Females (%)
Population - Males (%) - White
Population - Males (%) - Black or African American
Population - Males (%) - Asian
Population - Males (%) - Hispanic or Latino
Population - Males (%) - American Indian and Alaska Native
Population - Males (%) - Multirace
Population - Males (%) - Other Race
Population - Females (%) - White
Population - Females (%) - Black or African American
Population - Females (%) - Asian
Population - Females (%) - Hispanic or Latino
Population - Females (%) - American Indian and Alaska Native
Population - Females (%) - Multirace
Population - Females (%) - Other Race
Coronavirus confirmed cases (Apr 19, 2024)
Deaths caused by coronavirus (Apr 19, 2024)
Coronavirus confirmed cases (per 100k population) (Apr 19, 2024)
Deaths caused by coronavirus (per 100k population) (Apr 19, 2024)
Daily increase in number of cases (Apr 19, 2024)
Weekly increase in number of cases (Apr 19, 2024)
Cases doubled (in days) (Apr 19, 2024)
Hospitalized patients (Apr 18, 2022)
Negative test results (Apr 18, 2022)
Total test results (Apr 18, 2022)
COVID Vaccine doses distributed (per 100k population) (Sep 19, 2023)
COVID Vaccine doses administered (per 100k population) (Sep 19, 2023)
COVID Vaccine doses distributed (Sep 19, 2023)
COVID Vaccine doses administered (Sep 19, 2023)
Likely homosexual households (%)
Likely homosexual households (% change since 2000)
Likely homosexual households - Lesbian couples (%)
Likely homosexual households - Lesbian couples (% change since 2000)
Likely homosexual households - Gay men (%)
Likely homosexual households - Gay men (% change since 2000)
Cost of living index
Median gross rent ($)
Median contract rent ($)
Median monthly housing costs ($)
Median house or condo value ($)
Median house or condo value ($ change since 2000)
Mean house or condo value by units in structure - 1, detached ($)
Mean house or condo value by units in structure - 1, attached ($)
Mean house or condo value by units in structure - 2 ($)
Mean house or condo value by units in structure by units in structure - 3 or 4 ($)
Mean house or condo value by units in structure - 5 or more ($)
Mean house or condo value by units in structure - Boat, RV, van, etc. ($)
Mean house or condo value by units in structure - Mobile home ($)
Median house or condo value ($) - White
Median house or condo value ($) - Black or African American
Median house or condo value ($) - Asian
Median house or condo value ($) - Hispanic or Latino
Median house or condo value ($) - American Indian and Alaska Native
Median house or condo value ($) - Multirace
Median house or condo value ($) - Other Race
Median resident age
Resident age diversity
Median resident age - Males
Median resident age - Females
Median resident age - White
Median resident age - Black or African American
Median resident age - Asian
Median resident age - Hispanic or Latino
Median resident age - American Indian and Alaska Native
Median resident age - Multirace
Median resident age - Other Race
Median resident age - Males - White
Median resident age - Males - Black or African American
Median resident age - Males - Asian
Median resident age - Males - Hispanic or Latino
Median resident age - Males - American Indian and Alaska Native
Median resident age - Males - Multirace
Median resident age - Males - Other Race
Median resident age - Females - White
Median resident age - Females - Black or African American
Median resident age - Females - Asian
Median resident age - Females - Hispanic or Latino
Median resident age - Females - American Indian and Alaska Native
Median resident age - Females - Multirace
Median resident age - Females - Other Race
Commute - mean travel time to work (minutes)
Travel time to work - Less than 5 minutes (%)
Travel time to work - Less than 5 minutes (% change since 2000)
Travel time to work - 5 to 9 minutes (%)
Travel time to work - 5 to 9 minutes (% change since 2000)
Travel time to work - 10 to 19 minutes (%)
Travel time to work - 10 to 19 minutes (% change since 2000)
Travel time to work - 20 to 29 minutes (%)
Travel time to work - 20 to 29 minutes (% change since 2000)
Travel time to work - 30 to 39 minutes (%)
Travel time to work - 30 to 39 minutes (% change since 2000)
Travel time to work - 40 to 59 minutes (%)
Travel time to work - 40 to 59 minutes (% change since 2000)
Travel time to work - 60 to 89 minutes (%)
Travel time to work - 60 to 89 minutes (% change since 2000)
Travel time to work - 90 or more minutes (%)
Travel time to work - 90 or more minutes (% change since 2000)
Marital status - Never married (%)
Marital status - Now married (%)
Marital status - Separated (%)
Marital status - Widowed (%)
Marital status - Divorced (%)
Median family income ($)
Median family income (% change since 2000)
Median non-family income ($)
Median non-family income (% change since 2000)
Median per capita income ($)
Median per capita income (% change since 2000)
Median family income ($) - White
Median family income ($) - Black or African American
Median family income ($) - Asian
Median family income ($) - Hispanic or Latino
Median family income ($) - American Indian and Alaska Native
Median family income ($) - Multirace
Median family income ($) - Other Race
Median year house/condo built
Median year apartment built
Year house built - Built 2005 or later (%)
Year house built - Built 2000 to 2004 (%)
Year house built - Built 1990 to 1999 (%)
Year house built - Built 1980 to 1989 (%)
Year house built - Built 1970 to 1979 (%)
Year house built - Built 1960 to 1969 (%)
Year house built - Built 1950 to 1959 (%)
Year house built - Built 1940 to 1949 (%)
Year house built - Built 1939 or earlier (%)
Average household size
Household density (households per square mile)
Average household size - White
Average household size - Black or African American
Average household size - Asian
Average household size - Hispanic or Latino
Average household size - American Indian and Alaska Native
Average household size - Multirace
Average household size - Other Race
Occupied housing units (%)
Vacant housing units (%)
Owner occupied housing units (%)
Renter occupied housing units (%)
Vacancy status - For rent (%)
Vacancy status - For sale only (%)
Vacancy status - Rented or sold, not occupied (%)
Vacancy status - For seasonal, recreational, or occasional use (%)
Vacancy status - For migrant workers (%)
Vacancy status - Other vacant (%)
Residents with income below the poverty level (%)
Residents with income below 50% of the poverty level (%)
Children below poverty level (%)
Poor families by family type - Married-couple family (%)
Poor families by family type - Male, no wife present (%)
Poor families by family type - Female, no husband present (%)
Poverty status for native-born residents (%)
Poverty status for foreign-born residents (%)
Poverty among high school graduates not in families (%)
Poverty among people who did not graduate high school not in families (%)
Residents with income below the poverty level (%) - White
Residents with income below the poverty level (%) - Black or African American
Residents with income below the poverty level (%) - Asian
Residents with income below the poverty level (%) - Hispanic or Latino
Residents with income below the poverty level (%) - American Indian and Alaska Native
Residents with income below the poverty level (%) - Multirace
Residents with income below the poverty level (%) - Other Race
Air pollution - Air Quality Index (AQI)
Air pollution - CO
Air pollution - NO2
Air pollution - SO2
Air pollution - Ozone
Air pollution - PM10
Air pollution - PM25
Air pollution - Pb
Crime - Murders per 100,000 population
Crime - Rapes per 100,000 population
Crime - Robberies per 100,000 population
Crime - Assaults per 100,000 population
Crime - Burglaries per 100,000 population
Crime - Thefts per 100,000 population
Crime - Auto thefts per 100,000 population
Crime - Arson per 100,000 population
Crime - City-data.com crime index
Crime - Violent crime index
Crime - Property crime index
Crime - Murders per 100,000 population (5 year average)
Crime - Rapes per 100,000 population (5 year average)
Crime - Robberies per 100,000 population (5 year average)
Crime - Assaults per 100,000 population (5 year average)
Crime - Burglaries per 100,000 population (5 year average)
Crime - Thefts per 100,000 population (5 year average)
Crime - Auto thefts per 100,000 population (5 year average)
Crime - Arson per 100,000 population (5 year average)
Crime - City-data.com crime index (5 year average)
Crime - Violent crime index (5 year average)
Crime - Property crime index (5 year average)
1996 Presidential Elections Results (%) - Democratic Party (Clinton)
1996 Presidential Elections Results (%) - Republican Party (Dole)
1996 Presidential Elections Results (%) - Other
2000 Presidential Elections Results (%) - Democratic Party (Gore)
2000 Presidential Elections Results (%) - Republican Party (Bush)
2000 Presidential Elections Results (%) - Other
2004 Presidential Elections Results (%) - Democratic Party (Kerry)
2004 Presidential Elections Results (%) - Republican Party (Bush)
2004 Presidential Elections Results (%) - Other
2008 Presidential Elections Results (%) - Democratic Party (Obama)
2008 Presidential Elections Results (%) - Republican Party (McCain)
2008 Presidential Elections Results (%) - Other
2012 Presidential Elections Results (%) - Democratic Party (Obama)
2012 Presidential Elections Results (%) - Republican Party (Romney)
2012 Presidential Elections Results (%) - Other
2016 Presidential Elections Results (%) - Democratic Party (Clinton)
2016 Presidential Elections Results (%) - Republican Party (Trump)
2016 Presidential Elections Results (%) - Other
2020 Presidential Elections Results (%) - Democratic Party (Biden)
2020 Presidential Elections Results (%) - Republican Party (Trump)
2020 Presidential Elections Results (%) - Other
Ancestries Reported - Arab (%)
Ancestries Reported - Czech (%)
Ancestries Reported - Danish (%)
Ancestries Reported - Dutch (%)
Ancestries Reported - English (%)
Ancestries Reported - French (%)
Ancestries Reported - French Canadian (%)
Ancestries Reported - German (%)
Ancestries Reported - Greek (%)
Ancestries Reported - Hungarian (%)
Ancestries Reported - Irish (%)
Ancestries Reported - Italian (%)
Ancestries Reported - Lithuanian (%)
Ancestries Reported - Norwegian (%)
Ancestries Reported - Polish (%)
Ancestries Reported - Portuguese (%)
Ancestries Reported - Russian (%)
Ancestries Reported - Scotch-Irish (%)
Ancestries Reported - Scottish (%)
Ancestries Reported - Slovak (%)
Ancestries Reported - Subsaharan African (%)
Ancestries Reported - Swedish (%)
Ancestries Reported - Swiss (%)
Ancestries Reported - Ukrainian (%)
Ancestries Reported - United States (%)
Ancestries Reported - Welsh (%)
Ancestries Reported - West Indian (%)
Ancestries Reported - Other (%)
Educational Attainment - No schooling completed (%)
Educational Attainment - Less than high school (%)
Educational Attainment - High school or equivalent (%)
Educational Attainment - Less than 1 year of college (%)
Educational Attainment - 1 or more years of college (%)
Educational Attainment - Associate degree (%)
Educational Attainment - Bachelor's degree (%)
Educational Attainment - Master's degree (%)
Educational Attainment - Professional school degree (%)
Educational Attainment - Doctorate degree (%)
School Enrollment - Nursery, preschool (%)
School Enrollment - Kindergarten (%)
School Enrollment - Grade 1 to 4 (%)
School Enrollment - Grade 5 to 8 (%)
School Enrollment - Grade 9 to 12 (%)
School Enrollment - College undergrad (%)
School Enrollment - Graduate or professional (%)
School Enrollment - Not enrolled in school (%)
School enrollment - Public schools (%)
School enrollment - Private schools (%)
School enrollment - Not enrolled (%)
Median number of rooms in houses and condos
Median number of rooms in apartments
Housing units lacking complete plumbing facilities (%)
Housing units lacking complete kitchen facilities (%)
Density of houses
Urban houses (%)
Rural houses (%)
Households with people 60 years and over (%)
Households with people 65 years and over (%)
Households with people 75 years and over (%)
Households with one or more nonrelatives (%)
Households with no nonrelatives (%)
Population in households (%)
Family households (%)
Nonfamily households (%)
Population in families (%)
Family households with own children (%)
Median number of bedrooms in owner occupied houses
Mean number of bedrooms in owner occupied houses
Median number of bedrooms in renter occupied houses
Mean number of bedrooms in renter occupied houses
Median number of vehichles in owner occupied houses
Mean number of vehichles in owner occupied houses
Median number of vehichles in renter occupied houses
Mean number of vehichles in renter occupied houses
Mortgage status - with mortgage (%)
Mortgage status - with second mortgage (%)
Mortgage status - with home equity loan (%)
Mortgage status - with both second mortgage and home equity loan (%)
Mortgage status - without a mortgage (%)
Average family size
Average family size - White
Average family size - Black or African American
Average family size - Asian
Average family size - Hispanic or Latino
Average family size - American Indian and Alaska Native
Average family size - Multirace
Average family size - Other Race
Geographical mobility - Same house 1 year ago (%)
Geographical mobility - Moved within same county (%)
Geographical mobility - Moved from different county within same state (%)
Geographical mobility - Moved from different state (%)
Geographical mobility - Moved from abroad (%)
Place of birth - Born in state of residence (%)
Place of birth - Born in other state (%)
Place of birth - Native, outside of US (%)
Place of birth - Foreign born (%)
Housing units in structures - 1, detached (%)
Housing units in structures - 1, attached (%)
Housing units in structures - 2 (%)
Housing units in structures - 3 or 4 (%)
Housing units in structures - 5 to 9 (%)
Housing units in structures - 10 to 19 (%)
Housing units in structures - 20 to 49 (%)
Housing units in structures - 50 or more (%)
Housing units in structures - Mobile home (%)
Housing units in structures - Boat, RV, van, etc. (%)
House/condo owner moved in on average (years ago)
Renter moved in on average (years ago)
Year householder moved into unit - Moved in 1999 to March 2000 (%)
Year householder moved into unit - Moved in 1995 to 1998 (%)
Year householder moved into unit - Moved in 1990 to 1994 (%)
Year householder moved into unit - Moved in 1980 to 1989 (%)
Year householder moved into unit - Moved in 1970 to 1979 (%)
Year householder moved into unit - Moved in 1969 or earlier (%)
Means of transportation to work - Drove car alone (%)
Means of transportation to work - Carpooled (%)
Means of transportation to work - Public transportation (%)
Means of transportation to work - Bus or trolley bus (%)
Means of transportation to work - Streetcar or trolley car (%)
Means of transportation to work - Subway or elevated (%)
Means of transportation to work - Railroad (%)
Means of transportation to work - Ferryboat (%)
Means of transportation to work - Taxicab (%)
Means of transportation to work - Motorcycle (%)
Means of transportation to work - Bicycle (%)
Means of transportation to work - Walked (%)
Means of transportation to work - Other means (%)
Working at home (%)
Industry diversity
Most Common Industries - Agriculture, forestry, fishing and hunting, and mining (%)
Most Common Industries - Agriculture, forestry, fishing and hunting (%)
Most Common Industries - Mining, quarrying, and oil and gas extraction (%)
Most Common Industries - Construction (%)
Most Common Industries - Manufacturing (%)
Most Common Industries - Wholesale trade (%)
Most Common Industries - Retail trade (%)
Most Common Industries - Transportation and warehousing, and utilities (%)
Most Common Industries - Transportation and warehousing (%)
Most Common Industries - Utilities (%)
Most Common Industries - Information (%)
Most Common Industries - Finance and insurance, and real estate and rental and leasing (%)
Most Common Industries - Finance and insurance (%)
Most Common Industries - Real estate and rental and leasing (%)
Most Common Industries - Professional, scientific, and management, and administrative and waste management services (%)
Most Common Industries - Professional, scientific, and technical services (%)
Most Common Industries - Management of companies and enterprises (%)
Most Common Industries - Administrative and support and waste management services (%)
Most Common Industries - Educational services, and health care and social assistance (%)
Most Common Industries - Educational services (%)
Most Common Industries - Health care and social assistance (%)
Most Common Industries - Arts, entertainment, and recreation, and accommodation and food services (%)
Most Common Industries - Arts, entertainment, and recreation (%)
Most Common Industries - Accommodation and food services (%)
Most Common Industries - Other services, except public administration (%)
Most Common Industries - Public administration (%)
Occupation diversity
Most Common Occupations - Management, business, science, and arts occupations (%)
Most Common Occupations - Management, business, and financial occupations (%)
Most Common Occupations - Management occupations (%)
Most Common Occupations - Business and financial operations occupations (%)
Most Common Occupations - Computer, engineering, and science occupations (%)
Most Common Occupations - Computer and mathematical occupations (%)
Most Common Occupations - Architecture and engineering occupations (%)
Most Common Occupations - Life, physical, and social science occupations (%)
Most Common Occupations - Education, legal, community service, arts, and media occupations (%)
Most Common Occupations - Community and social service occupations (%)
Most Common Occupations - Legal occupations (%)
Most Common Occupations - Education, training, and library occupations (%)
Most Common Occupations - Arts, design, entertainment, sports, and media occupations (%)
Most Common Occupations - Healthcare practitioners and technical occupations (%)
Most Common Occupations - Health diagnosing and treating practitioners and other technical occupations (%)
Most Common Occupations - Health technologists and technicians (%)
Most Common Occupations - Service occupations (%)
Most Common Occupations - Healthcare support occupations (%)
Most Common Occupations - Protective service occupations (%)
Most Common Occupations - Fire fighting and prevention, and other protective service workers including supervisors (%)
Most Common Occupations - Law enforcement workers including supervisors (%)
Most Common Occupations - Food preparation and serving related occupations (%)
Most Common Occupations - Building and grounds cleaning and maintenance occupations (%)
Most Common Occupations - Personal care and service occupations (%)
Most Common Occupations - Sales and office occupations (%)
Most Common Occupations - Sales and related occupations (%)
Most Common Occupations - Office and administrative support occupations (%)
Most Common Occupations - Natural resources, construction, and maintenance occupations (%)
Most Common Occupations - Farming, fishing, and forestry occupations (%)
Most Common Occupations - Construction and extraction occupations (%)
Most Common Occupations - Installation, maintenance, and repair occupations (%)
Most Common Occupations - Production, transportation, and material moving occupations (%)
Most Common Occupations - Production occupations (%)
Most Common Occupations - Transportation occupations (%)
Most Common Occupations - Material moving occupations (%)
People in Group quarters - Institutionalized population (%)
People in Group quarters - Correctional institutions (%)
People in Group quarters - Federal prisons and detention centers (%)
People in Group quarters - Halfway houses (%)
People in Group quarters - Local jails and other confinement facilities (including police lockups) (%)
People in Group quarters - Military disciplinary barracks (%)
People in Group quarters - State prisons (%)
People in Group quarters - Other types of correctional institutions (%)
People in Group quarters - Nursing homes (%)
People in Group quarters - Hospitals/wards, hospices, and schools for the handicapped (%)
People in Group quarters - Hospitals/wards and hospices for chronically ill (%)
People in Group quarters - Hospices or homes for chronically ill (%)
People in Group quarters - Military hospitals or wards for chronically ill (%)
People in Group quarters - Other hospitals or wards for chronically ill (%)
People in Group quarters - Hospitals or wards for drug/alcohol abuse (%)
People in Group quarters - Mental (Psychiatric) hospitals or wards (%)
People in Group quarters - Schools, hospitals, or wards for the mentally retarded (%)
People in Group quarters - Schools, hospitals, or wards for the physically handicapped (%)
People in Group quarters - Institutions for the deaf (%)
People in Group quarters - Institutions for the blind (%)
People in Group quarters - Orthopedic wards and institutions for the physically handicapped (%)
People in Group quarters - Wards in general hospitals for patients who have no usual home elsewhere (%)
People in Group quarters - Wards in military hospitals for patients who have no usual home elsewhere (%)
People in Group quarters - Juvenile institutions (%)
People in Group quarters - Long-term care (%)
People in Group quarters - Homes for abused, dependent, and neglected children (%)
People in Group quarters - Residential treatment centers for emotionally disturbed children (%)
People in Group quarters - Training schools for juvenile delinquents (%)
People in Group quarters - Short-term care, detention or diagnostic centers for delinquent children (%)
People in Group quarters - Type of juvenile institution unknown (%)
People in Group quarters - Noninstitutionalized population (%)
People in Group quarters - College dormitories (includes college quarters off campus) (%)
People in Group quarters - Military quarters (%)
People in Group quarters - On base (%)
People in Group quarters - Barracks, unaccompanied personnel housing (UPH), (Enlisted/Officer), ;and similar group living quarters for military personnel (%)
People in Group quarters - Transient quarters for temporary residents (%)
People in Group quarters - Military ships (%)
People in Group quarters - Group homes (%)
People in Group quarters - Homes or halfway houses for drug/alcohol abuse (%)
People in Group quarters - Homes for the mentally ill (%)
People in Group quarters - Homes for the mentally retarded (%)
People in Group quarters - Homes for the physically handicapped (%)
People in Group quarters - Other group homes (%)
People in Group quarters - Religious group quarters (%)
People in Group quarters - Dormitories (%)
People in Group quarters - Agriculture workers' dormitories on farms (%)
People in Group quarters - Job Corps and vocational training facilities (%)
People in Group quarters - Other workers' dormitories (%)
People in Group quarters - Crews of maritime vessels (%)
People in Group quarters - Other nonhousehold living situations (%)
People in Group quarters - Other noninstitutional group quarters (%)
Residents speaking English at home (%)
Residents speaking English at home - Born in the United States (%)
Residents speaking English at home - Native, born elsewhere (%)
Residents speaking English at home - Foreign born (%)
Residents speaking Spanish at home (%)
Residents speaking Spanish at home - Born in the United States (%)
Residents speaking Spanish at home - Native, born elsewhere (%)
Residents speaking Spanish at home - Foreign born (%)
Residents speaking other language at home (%)
Residents speaking other language at home - Born in the United States (%)
Residents speaking other language at home - Native, born elsewhere (%)
Residents speaking other language at home - Foreign born (%)
Class of Workers - Employee of private company (%)
Class of Workers - Self-employed in own incorporated business (%)
Class of Workers - Private not-for-profit wage and salary workers (%)
Class of Workers - Local government workers (%)
Class of Workers - State government workers (%)
Class of Workers - Federal government workers (%)
Class of Workers - Self-employed workers in own not incorporated business and Unpaid family workers (%)
House heating fuel used in houses and condos - Utility gas (%)
House heating fuel used in houses and condos - Bottled, tank, or LP gas (%)
House heating fuel used in houses and condos - Electricity (%)
House heating fuel used in houses and condos - Fuel oil, kerosene, etc. (%)
House heating fuel used in houses and condos - Coal or coke (%)
House heating fuel used in houses and condos - Wood (%)
House heating fuel used in houses and condos - Solar energy (%)
House heating fuel used in houses and condos - Other fuel (%)
House heating fuel used in houses and condos - No fuel used (%)
House heating fuel used in apartments - Utility gas (%)
House heating fuel used in apartments - Bottled, tank, or LP gas (%)
House heating fuel used in apartments - Electricity (%)
House heating fuel used in apartments - Fuel oil, kerosene, etc. (%)
House heating fuel used in apartments - Coal or coke (%)
House heating fuel used in apartments - Wood (%)
House heating fuel used in apartments - Solar energy (%)
House heating fuel used in apartments - Other fuel (%)
House heating fuel used in apartments - No fuel used (%)
Armed forces status - In Armed Forces (%)
Armed forces status - Civilian (%)
Armed forces status - Civilian - Veteran (%)
Armed forces status - Civilian - Nonveteran (%)
Fatal accidents locations in years 2005-2021
Fatal accidents locations in 2005
Fatal accidents locations in 2006
Fatal accidents locations in 2007
Fatal accidents locations in 2008
Fatal accidents locations in 2009
Fatal accidents locations in 2010
Fatal accidents locations in 2011
Fatal accidents locations in 2012
Fatal accidents locations in 2013
Fatal accidents locations in 2014
Fatal accidents locations in 2015
Fatal accidents locations in 2016
Fatal accidents locations in 2017
Fatal accidents locations in 2018
Fatal accidents locations in 2019
Fatal accidents locations in 2020
Fatal accidents locations in 2021
Alcohol use - People drinking some alcohol every month (%)
Alcohol use - People not drinking at all (%)
Alcohol use - Average days/month drinking alcohol
Alcohol use - Average drinks/week
Alcohol use - Average days/year people drink much
Audiometry - Average condition of hearing (%)
Audiometry - People that can hear a whisper from across a quiet room (%)
Audiometry - People that can hear normal voice from across a quiet room (%)
Audiometry - Ears ringing, roaring, buzzing (%)
Audiometry - Had a job exposure to loud noise (%)
Audiometry - Had off-work exposure to loud noise (%)
Blood Pressure & Cholesterol - Has high blood pressure (%)
Blood Pressure & Cholesterol - Checking blood pressure at home (%)
Blood Pressure & Cholesterol - Frequently checking blood cholesterol (%)
Blood Pressure & Cholesterol - Has high cholesterol level (%)
Consumer Behavior - Money monthly spent on food at supermarket/grocery store
Consumer Behavior - Money monthly spent on food at other stores
Consumer Behavior - Money monthly spent on eating out
Consumer Behavior - Money monthly spent on carryout/delivered foods
Consumer Behavior - Income spent on food at supermarket/grocery store (%)
Consumer Behavior - Income spent on food at other stores (%)
Consumer Behavior - Income spent on eating out (%)
Consumer Behavior - Income spent on carryout/delivered foods (%)
Current Health Status - General health condition (%)
Current Health Status - Blood donors (%)
Current Health Status - Has blood ever tested for HIV virus (%)
Current Health Status - Left-handed people (%)
Dermatology - People using sunscreen (%)
Diabetes - Diabetics (%)
Diabetes - Had a blood test for high blood sugar (%)
Diabetes - People taking insulin (%)
Diet Behavior & Nutrition - Diet health (%)
Diet Behavior & Nutrition - Milk product consumption (# of products/month)
Diet Behavior & Nutrition - Meals not home prepared (#/week)
Diet Behavior & Nutrition - Meals from fast food or pizza place (#/week)
Diet Behavior & Nutrition - Ready-to-eat foods (#/month)
Diet Behavior & Nutrition - Frozen meals/pizza (#/month)
Drug Use - People that ever used marijuana or hashish (%)
Drug Use - Ever used hard drugs (%)
Drug Use - Ever used any form of cocaine (%)
Drug Use - Ever used heroin (%)
Drug Use - Ever used methamphetamine (%)
Health Insurance - People covered by health insurance (%)
Kidney Conditions-Urology - Avg. # of times urinating at night
Medical Conditions - People with asthma (%)
Medical Conditions - People with anemia (%)
Medical Conditions - People with psoriasis (%)
Medical Conditions - People with overweight (%)
Medical Conditions - Elderly people having difficulties in thinking or remembering (%)
Medical Conditions - People who ever received blood transfusion (%)
Medical Conditions - People having trouble seeing even with glass/contacts (%)
Medical Conditions - People with arthritis (%)
Medical Conditions - People with gout (%)
Medical Conditions - People with congestive heart failure (%)
Medical Conditions - People with coronary heart disease (%)
Medical Conditions - People with angina pectoris (%)
Medical Conditions - People who ever had heart attack (%)
Medical Conditions - People who ever had stroke (%)
Medical Conditions - People with emphysema (%)
Medical Conditions - People with thyroid problem (%)
Medical Conditions - People with chronic bronchitis (%)
Medical Conditions - People with any liver condition (%)
Medical Conditions - People who ever had cancer or malignancy (%)
Mental Health - People who have little interest in doing things (%)
Mental Health - People feeling down, depressed, or hopeless (%)
Mental Health - People who have trouble sleeping or sleeping too much (%)
Mental Health - People feeling tired or having little energy (%)
Mental Health - People with poor appetite or overeating (%)
Mental Health - People feeling bad about themself (%)
Mental Health - People who have trouble concentrating on things (%)
Mental Health - People moving or speaking slowly or too fast (%)
Mental Health - People having thoughts they would be better off dead (%)
Oral Health - Average years since last visit a dentist
Oral Health - People embarrassed because of mouth (%)
Oral Health - People with gum disease (%)
Oral Health - General health of teeth and gums (%)
Oral Health - Average days a week using dental floss/device
Oral Health - Average days a week using mouthwash for dental problem
Oral Health - Average number of teeth
Pesticide Use - Households using pesticides to control insects (%)
Pesticide Use - Households using pesticides to kill weeds (%)
Physical Activity - People doing vigorous-intensity work activities (%)
Physical Activity - People doing moderate-intensity work activities (%)
Physical Activity - People walking or bicycling (%)
Physical Activity - People doing vigorous-intensity recreational activities (%)
Physical Activity - People doing moderate-intensity recreational activities (%)
Physical Activity - Average hours a day doing sedentary activities
Physical Activity - Average hours a day watching TV or videos
Physical Activity - Average hours a day using computer
Physical Functioning - People having limitations keeping them from working (%)
Physical Functioning - People limited in amount of work they can do (%)
Physical Functioning - People that need special equipment to walk (%)
Physical Functioning - People experiencing confusion/memory problems (%)
Physical Functioning - People requiring special healthcare equipment (%)
Prescription Medications - Average number of prescription medicines taking
Preventive Aspirin Use - Adults 40+ taking low-dose aspirin (%)
Reproductive Health - Vaginal deliveries (%)
Reproductive Health - Cesarean deliveries (%)
Reproductive Health - Deliveries resulted in a live birth (%)
Reproductive Health - Pregnancies resulted in a delivery (%)
Reproductive Health - Women breastfeeding newborns (%)
Reproductive Health - Women that had a hysterectomy (%)
Reproductive Health - Women that had both ovaries removed (%)
Reproductive Health - Women that have ever taken birth control pills (%)
Reproductive Health - Women taking birth control pills (%)
Reproductive Health - Women that have ever used Depo-Provera or injectables (%)
Reproductive Health - Women that have ever used female hormones (%)
Sexual Behavior - People 18+ that ever had sex (vaginal, anal, or oral) (%)
Sexual Behavior - Males 18+ that ever had vaginal sex with a woman (%)
Sexual Behavior - Males 18+ that ever performed oral sex on a woman (%)
Sexual Behavior - Males 18+ that ever had anal sex with a woman (%)
Sexual Behavior - Males 18+ that ever had any sex with a man (%)
Sexual Behavior - Females 18+ that ever had vaginal sex with a man (%)
Sexual Behavior - Females 18+ that ever performed oral sex on a man (%)
Sexual Behavior - Females 18+ that ever had anal sex with a man (%)
Sexual Behavior - Females 18+ that ever had any kind of sex with a woman (%)
Sexual Behavior - Average age people first had sex
Sexual Behavior - Average number of female sex partners in lifetime (males 18+)
Sexual Behavior - Average number of female vaginal sex partners in lifetime (males 18+)
Sexual Behavior - Average age people first performed oral sex on a woman (18+)
Sexual Behavior - Average number of woman performed oral sex on in lifetime (18+)
Sexual Behavior - Average number of male sex partners in lifetime (males 18+)
Sexual Behavior - Average number of male anal sex partners in lifetime (males 18+)
Sexual Behavior - Average age people first performed oral sex on a man (18+)
Sexual Behavior - Average number of male oral sex partners in lifetime (18+)
Sexual Behavior - People using protection when performing oral sex (%)
Sexual Behavior - Average number of times people have vaginal or anal sex a year
Sexual Behavior - People having sex without condom (%)
Sexual Behavior - Average number of male sex partners in lifetime (females 18+)
Sexual Behavior - Average number of male vaginal sex partners in lifetime (females 18+)
Sexual Behavior - Average number of female sex partners in lifetime (females 18+)
Sexual Behavior - Circumcised males 18+ (%)
Sleep Disorders - Average hours sleeping at night
Sleep Disorders - People that has trouble sleeping (%)
Smoking-Cigarette Use - People smoking cigarettes (%)
Taste & Smell - People 40+ having problems with smell (%)
Taste & Smell - People 40+ having problems with taste (%)
Taste & Smell - People 40+ that ever had wisdom teeth removed (%)
Taste & Smell - People 40+ that ever had tonsils teeth removed (%)
Taste & Smell - People 40+ that ever had a loss of consciousness because of a head injury (%)
Taste & Smell - People 40+ that ever had a broken nose or other serious injury to face or skull (%)
Taste & Smell - People 40+ that ever had two or more sinus infections (%)
Weight - Average height (inches)
Weight - Average weight (pounds)
Weight - Average BMI
Weight - People that are obese (%)
Weight - People that ever were obese (%)
Weight - People trying to lose weight (%)

 Please register to participate in our discussions with 2 million other members - it's free and quick! Some forums can only be seen by registered members. After you create your account, you'll be able to customize options and access all our 15,000 new posts/day with fewer ads.