Please register to participate in our discussions with 2 million other members - it's free and quick! Some forums can only be seen by registered members. After you create your account, you'll be able to customize options and access all our 15,000 new posts/day with fewer ads.
Aside from a purely curiosity standpoint the population density of states have little meaning. Cities create population density and not states. To those who say "I prefer to live in low density states" you do realize that even in the high density states there are probably plenty of areas (in fact probably most of any state's land area) that could be as low or lower density than where you live or prefer to live.
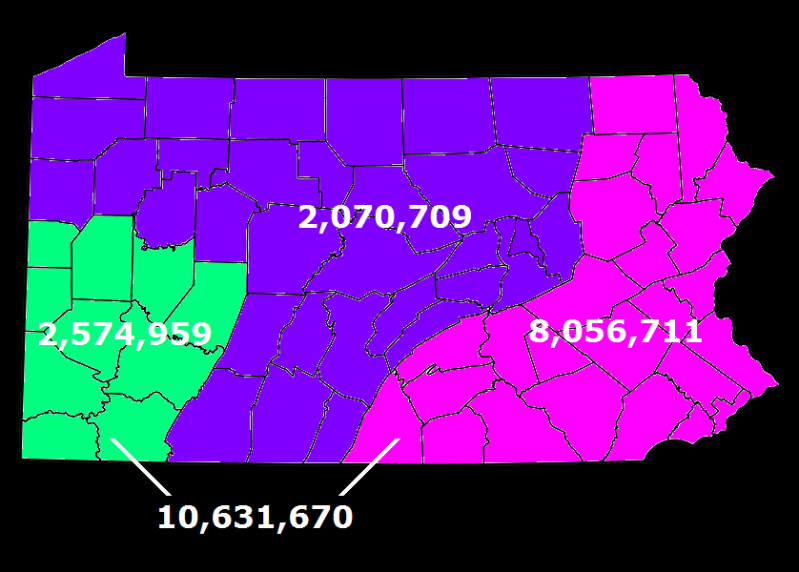
I actually illustrated this on the Pennsylvania message board. I created a map illustrating the population density in eastern Pennsylvania, southwestern Pennsylvania, and the remainder of Pennsylvania. This is what I came up with:
(NOTE: I included the Scranton/Wilkes-Barre MSA with the rest of eastern Pennsylvania because of its increasing alignment with the Northeast megalopolis.)
Southwestern Pennsylvania has 2,574,959 people in 7,114 square miles, which is 361.8 people per square mile. Eastern Pennsylvania has 8,056,711 people in 14,719 square miles, which is 547.4 people per square mile. Together, those two predominantly urban regions of Pennsylvania have 10,631,670 people in 21,837 square miles, which is 486.9 people per square mile.
On the other hand, the predominantly rural remainder of Pennsylvania has only 2,070,709 people in 24,211 square miles, which is a mere 85.5 people per square mile, and less than the population density for the United States as a whole.
Ohio suprises me, kinda strange seeing it lumped in with the northeast as being densely populated. I know there are some large cities there, but it just doesnt seem to be as dense as the northeast when you visit the place. Illinois and Michigan would drop back 10 states in the ranking if it were not for the small corners of those states that Chicago and Detroit occupy. In fact those two states are quite rural outside of a few counties where those cities are. Virgina and the two Carolinas are getting overpopulated too, and that map reflects that fact. Three states in the green eastern half of the country that show low population density, Arkansas, Minnesota and Maine, those would be the states to move to. All three states are very nice places and offer some of the best of thier respective regions.
Ohio suprises me, kinda strange seeing it lumped in with the northeast as being densely populated. I know there are some large cities there, but it just doesnt seem to be as dense as the northeast when you visit the place. Illinois and Michigan would drop back 10 states in the ranking if it were not for the small corners of those states that Chicago and Detroit occupy. In fact those two states are quite rural outside of a few counties where those cities are. Virgina and the two Carolinas are getting overpopulated too, and that map reflects that fact. Three states in the green eastern half of the country that show low population density, Arkansas, Minnesota and Maine, those would be the states to move to. All three states are very nice places and offer some of the best of thier respective regions.
Ohio in many ways is less rural than a NY or PA. The majority of the state is dotted with many large towns and small to mid-sized cities all fairly close. In contrast to PA and NYC which are mostly more rural with very large cities in the SE corners of each, This is where averages are difficult to compare. PA and OH have a similar density but with significantly different make-ups. probably half to 2/3rds of PA is Appalachian, very mountainous and has more in common with WV. Ohio on the Whole feels built out more like the Eastern side of the Appalchian (sans Philly)
It's interesting to compare this map with a map of states by population living in urban areas (as classified by the 2000 Census):
(Numbers within the states refer to their ranking; 1 = highest percentage of population living in urban areas)
California and New Jersey are tied for the rank of largest urban population (94.4%), while Vermont has the smallest proportion of urban residents (a mere 38.2%). Not surprisingly, most of the small East Coast states with major cities rank fairly high. However, even much larger states with a tremendous proportion of agricultural land, like Illinois and Texas, have remarkably urban populations. This shows just how concentrated these states’ populations are in large cities.
Note that the percentage of urban population is a rather poor indicator of population density overall. Nevada, which was only the 43rd most densely populated state in 2000, had the 3rd most urban population. There aren’t many brave souls living out in the Nevada desert — most prefer the bright lights of Las Vegas and Reno. By contrast, a relatively densely populated state like North Carolina (17th densest in 2000) only ranks 39 in urban population, indicating that a lot of Tar Heels still live in small towns.
When it comes to the west, there is a striking difference between the Northwest (specifically the northern Great Plains) and the desert Southwest. Montana and the Dakotas still have very rural populations, while most people in the Southwest flock to cities.
Finally, note that only four states — Vermont, Maine, West Virginia, and Mississippi — have a rural majority. In 1950, that number was nineteen.
To be fair, the census' definition of "urban" includes many areas that most of us would instinctively classify as "suburban." Unfortunately, I've yet to see a more fine-tuned classification.
Interesting CA does a good job with development. NJ is by default as the majority of the state falls into one of three categories (Suburbs of NYC or Philly, Shore Towns, and Pine Barrens (not developed).
On urban, this cutoff is like 1,000 ppsm. really more exurban but a very interesting stats none-the-less.
PURPLE - States with 1,000 or more people per square mile.
BLUE - States with 500 to 999 people per square mile.
GREEN - States with 250 to 499 people per square mile.
YELLOW - States with 100 to 249 people per square mile.
ORANGE - States with 50 to 99 people per square mile.
RED - States with 10 to 49 people per square mile.
BROWN - States with less than 10 people per square mile.
* - Denotes that ties between states are broken by decimal points.
Notes
Numbers on the map are each state's ranking in population density.
Numbers on the list are people per square mile rounded to the nearest whole number.
The population density of Washington DC is 9,857 people per square mile.
The population density of the United States is 87 people per square mile.
Well, it seems like your "yellow" looked more of yellow-green. If it's not, then I guess I'm getting a bit colorblind...
Please register to post and access all features of our very popular forum. It is free and quick. Over $68,000 in prizes has already been given out to active posters on our forum. Additional giveaways are planned.
Detailed information about all U.S. cities, counties, and zip codes on our site: City-data.com.

 Please register to participate in our discussions with 2 million other members - it's free and quick! Some forums can only be seen by registered members. After you create your account, you'll be able to customize options and access all our 15,000 new posts/day with fewer ads.