Please register to participate in our discussions with 2 million other members - it's free and quick! Some forums can only be seen by registered members. After you create your account, you'll be able to customize options and access all our 15,000 new posts/day with fewer ads.
I don't get these chart readers either but some people swear by it, and if they are making $$, that's all that matters. As for Amazon, the trend is still up.
I made the call AMZN would move based partially on charts earlier in this thread. I will make them prediction it has a pull back after August also based on them. It moves like that every year. The next struggle should be at $3,500 although sometimes the stock has to fight for every $100. Increment. Sometimes it’s just psychological numbers.
Take a look for the past five years it’s like old faithful.
This is zero surprise and reason why the whole "news" about this attempt at unionizing was a non-issue for me. I'm a long-term shareholder in AMZN as I have been for many years now. And I'm not a big believer in technical analysis either, if I was I'd have probably sold AMZN a long time ago. I could care less what "resistance" there may be at some fairly random number because they've broken through any/all numbers since day 1.
If you are simply holding long nothing really matters. However knowing support and resistance is useful for finding an entry and knowing when to add. I don’t use PE for example. You don’t like charts. I know at the moment if AMZN falls below $3,200 it’s a no brainer to add some. I did say AMZN days of buying under $3,000 are over and the stock would ruin soon as it does every year.
Buy and hold however you want. If you don’t care about the union that’s also not any real news. It didn’t happen and investors prefer boring. A reason the stock rose Friday. I buy 99% based upon if I think the company is going to shine in the future and AMZN will. However a quick peek at support levels doesn’t hurt.
A triple top or head and shoulders will make me think harder if I really like the company before buying. To each their own YMMV.
Considering the Nasdaq is back near ATH set in February, I’m surprised AMZN isn’t trading higher especially with the recent positive union news. It’s surprisingly still stuck in the same range it’s been in since last summer. I imagine at some point in the near future it will breakout above this range but whether that’s this month or six plus months from now who knows.
A triple top or head and shoulders will make me think harder if I really like the company before buying. To each their own YMMV.
See, this is what's crazy to me. People make buy/sell decisions based on the SHAPE of a chart, not taking into account much else (triple head???).
Day trading is a loser's game no matter what analysis you use for 95% of people attempting that stuff unless you're one and done. The statistics back that up. I could care less what shape a chart is, nor what it traded at in the past before dropping 10%. That's random and pointless for a long-term investor.
Resistance levels are very real whether you draw them on a chart or just remember that a particular stock hasn't stayed above $3320 longer than a day for the last eight months even though it's done so seven times. There are levels at which large numbers of people will sell and levels at which other people will buy and recognizing those levels can be useful. You don't have to be a day trader to make use of those stats.
See, this is what's crazy to me. People make buy/sell decisions based on the SHAPE of a chart, not taking into account much else (triple head???).
Day trading is a loser's game no matter what analysis you use for 95% of people attempting that stuff unless you're one and done. The statistics back that up. I could care less what shape a chart is, nor what it traded at in the past before dropping 10%. That's random and pointless for a long-term investor.
Triple head Is when a stock attempts to make a new high with three distinct sharp moves up with an immediate drop after each one. It goes back to a level of consolidation. When a stock tests three times and fails that’s a pretty good sign nobody is interested in buying at that level. You take other things into account but when a stock fails to break out three times in a row you also know you are going to probably be range based for awhile. You will see this occurred in AMZN right before it got stuck for the past whatever it has been.
Because many traders use charts and trends they make it do that. It isn’t the shape it is the levels of support and resistance. Also take a look at the past 5 years and tell me AMZN doesn’t always move this time of year.
Because you lack the knowledge to interpret a chart doesn’t mean they are useful. If that is the case why does every broker on the planet inclined a chart when you go to buy? Do you look at it or should you not look because it doesn’t matter?
I called AMZN’s move way back in this thread because the triple head was a Saigon it would probably by stuck in a range, which it was until, it breaks out now which it does around this time every year.
If you see another triple form you know it’s days of skyrocketing are coming to a close.
In this chart around September to November you can see a very obvious triple head. It could be said July was the first spike. Whatever that pattern is normally bearish.
Resistance levels are very real whether you draw them on a chart or just remember that a particular stock hasn't stayed above $3320 longer than a day for the last eight months even though it's done so seven times. There are levels at which large numbers of people will sell and levels at which other people will buy and recognizing those levels can be useful. You don't have to be a day trader to make use of those stats.
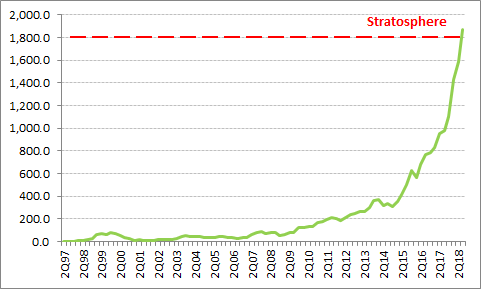
We're talking about Amazon here. I see no "resistance" anywhere in this stock for the last two decades (note this chart is dated but you get the point. If I'm trying to buy on a dip by looking a some technical analysis chart, I'd have missed out on tens of thousands of dollars in gains. Sorry, again I state "not applicable."
We're talking about Amazon here. I see no "resistance" anywhere in this stock for the last two decades (note this chart is dated but you get the point. If I'm trying to buy on a dip by looking a some technical analysis chart, I'd have missed out on tens of thousands of dollars in gains. Sorry, again I state "not applicable."
That is a chart crime of epic proportions, especially since it doesn't even contain the eight month period I referenced. Kinda hard to make a buy or sell decision using a 20 year chart but, heh, you do you. Best of luck. I like the stock.
That is a chart crime of epic proportions, especially since it doesn't even contain the eight month period I referenced. Kinda hard to make a buy or sell decision using a 20 year chart but, heh, you do you. Best of luck. I like the stock.
Can’t rep you again. Sometimes you can explain something to them but you can’t understand it for them. I won’t bother explaining anything to that guy in the future as he seems to want to argue rather than learn.
Please register to post and access all features of our very popular forum. It is free and quick. Over $68,000 in prizes has already been given out to active posters on our forum. Additional giveaways are planned.
Detailed information about all U.S. cities, counties, and zip codes on our site: City-data.com.

 Please register to participate in our discussions with 2 million other members - it's free and quick! Some forums can only be seen by registered members. After you create your account, you'll be able to customize options and access all our 15,000 new posts/day with fewer ads.