Please register to participate in our discussions with 2 million other members - it's free and quick! Some forums can only be seen by registered members. After you create your account, you'll be able to customize options and access all our 15,000 new posts/day with fewer ads.
Maybe you should explain how debt will enslave the next generation. Will they have to put their money in a time capsule and send it back to the past to pay their debts?
In fact, yes! A huge part of the debt is to pension plans. Even if the next generations decide to default on the obligations to the foreign investors, they will need to pay to the retired people, or let them starve to death.
Moreover, defaulting on foreign obligations will have serious consequences too:
1. The government won't be able to raise additional money, and it's unclear how it can live without deficit.
2. China might actually start a war over this. Chances are we'll loose. Unless you think they will finance our military to fight them.
I don't think you're understanding my point. There's no such thing as intertemporal debt.
And obligations to foreign investors are tiny, hardly worth thinking about. Most of our debt is to ourselves, which means "we" don't have nearly as much debt as alarmists sometimes like to think. It's simply a matter of which pots the money is in.
Quote:
Originally Posted by steven_h
This is the only thing that matters:
Sure we have a low unemployment rate, but only because we have the lowest participation rate in 40 years.
If only ONE person has a job, and the unemployed aren't looking... that would be 0% unemployment.
They should use the same metrics to determine unemployment as they did during the Kennedy years.
This metric has problems, too. I agree that it's a good measure of the impact of unemployment in the short-term for a recession, when discouraged workers are a major problem. But long-term, you run into issues like demographic shifts that change the participation rate but have nothing to do with economic health. I'm sure someone could think of other problems with this measure as well, in the context of discussing unemployment.
I don't think you're understanding my point. There's no such thing as intertemporal debt.
And obligations to foreign investors are tiny, hardly worth thinking about. Most of our debt is to ourselves, which means "we" don't have nearly as much debt as alarmists sometimes like to think. It's simply a matter of which pots the money is in.
So why do we work? Let the government take 1000 trillion more in debt and we'll live in endless richness ever after. Makes sense? As much sense as your logic.
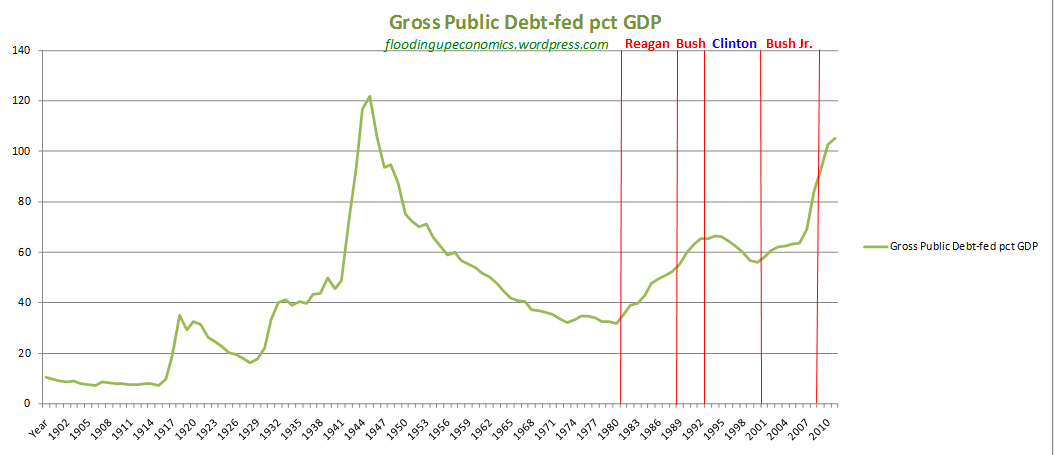
The only debt reduction I see is 1947, but according to the graph below, the tax rate actually went down that year. The debt increased ever since, even though the tax rate in 1950 went up again.
Ain't it cool how you can make charts look really scary by not accounting for obvious factors like inflation and economic expansion?
Here's a more reality-based chart that demonstrates how the national debt as a percentage of GDP went on a long, steady decline during an era with the highest marginal tax rates the U.S. has ever seen:
Now I know this doesn't fit the Teapublican narrative of gloom, doom, and wealth-worship. But them's the facts just the same.
Its a commonly used number by lots of people, media and businesses. Because it is common does not mean that it is being manipulated or an attempt to deceive. Its one statistic among many. The trend lines for most of the employment statistics are showing significant improvements. That includes the numbers that Gallup produces which are tracking the the BLS numbers pretty closely. Making the Gallup CEO complaints bizarre, since own companies numbers tend to confirm the BLS numbers.
What is bizarre, is trying to claim the U3 number is an accurate representation for the economy and jobs. The labor participation rate is at a 40 year low, so common sense tells you if a smaller percentage of Americans are working, then a larger percentage of them are unemployed.
Then add the fifty year high in the US poverty level, and we can see that millions more Americans have become the newly poor.
So use common sense, if fewer Americans are in the labor force as a percentage of the population, and a larger percentage of Americans have become the new poor, then our economy is in trouble. So any politician using the U3 figure as proof of a great economy is being disingenuous.
So why do we work? Let the government take 1000 trillion more in debt and we'll live in endless richness ever after. Makes sense? As much sense as your logic.
The past six years of 0bama show us where all that money goes, it goes to the top 1%. Meanwhile the poverty level climbs to a fifty yer high. 0bama's policies have impoverished the poor, and made the wealthy even more wealthy.
The left could give a rat's ass about the poor until a Republican is president, then suddenly the cable TV news reports and documentaries about poverty and homelessness in America will start being played.
What is bizarre, is trying to claim the U3 number is an accurate representation for the economy and jobs. The labor participation rate is at a 40 year low, so common sense tells you if a smaller percentage of Americans are working, then a larger percentage of them are unemployed.
Then add the fifty year high in the US poverty level, and we can see that millions more Americans have become the newly poor.
So use common sense, if fewer Americans are in the labor force as a percentage of the population, and a larger percentage of Americans have become the new poor, then our economy is in trouble. So any politician using the U3 figure as proof of a great economy is being disingenuous.
What are the largest segments of the population that are contributing to the LFPR? The LFPR will be going lower even with strong economic growth. The fact that the LFPR has been basically flat for around a year, which considering the demographic pressures, is a pretty could sign that the employment situation is improving.
There are a lot of other measures that also show an improving job situation. The U6 number has also been declining for some time now. The number of people working part time for economic reasons, although still high, has been declining. The initial jobless claims number has been at historic lows for months now.
the Labor participation has not been flat for a year.
Please register to post and access all features of our very popular forum. It is free and quick. Over $68,000 in prizes has already been given out to active posters on our forum. Additional giveaways are planned.
Detailed information about all U.S. cities, counties, and zip codes on our site: City-data.com.

 Please register to participate in our discussions with 2 million other members - it's free and quick! Some forums can only be seen by registered members. After you create your account, you'll be able to customize options and access all our 15,000 new posts/day with fewer ads.