Please register to participate in our discussions with 2 million other members - it's free and quick! Some forums can only be seen by registered members. After you create your account, you'll be able to customize options and access all our 15,000 new posts/day with fewer ads.
you are not backing "your claims" (i.e., your pointing to contrarian, cherry picking headlines) up at all. but then, that's probably obvious to anyone reading this...
So you read those links I see. Yep? Nope? Headlines? LOL please show me my headlines.
I hope you know that your wonderful support group is the one flashing news papers and wiki links and using the suspect data as proof.
Hey folks, I swear this man didn't kill anyone, he just told me he didn't! You are brilliant. Seriously, Id give you a 1st grade report of maybe a D, but then that might upset you so we will just give you an A so you feel better.
Chill, dude, no need to get all emotional. I'm not saying any of the things that you say that I'm saying. For all we know you could be totally right. Maybe the world's getting colder. Maybe bacteria from Jupiter are going to descend from the heavens in a month and give us superpowers. Maybe all the Christians will be raptured tomorrow and the rest of us will be stuck in those Left Behind books. Who knows? Nobody knows. I never claim to have "absolute knowledge" or "indisputable facts" about anything because everything is vunerable to dispute within a person's own mind... maybe I'm not looking at a computer screen right now, maybe I'm just dreaming, right? Maybe I'll wake up tomorrow as a gorilla and discover that my whole human life was just some science experiment performed on me by the real intelligent race, mastadons from 2,000,000 BC.
I don't know. But if the vast majority of people who study something are saying that their studies say that we're doing some bad **** and should cut down on it some, or risk people being hurt, displaced, and starved down the line, then I'm going to put some degree of faith in their expertise because I can't do the studies myself. Could they be wrong? Yes, they could be wrong. But I put more faith in the process of peer review, revision, and scientific progress than I do in the arguments of a minority of contrarians whose arguments, for whatever reason, have not been accepted or legitimized by most of the scientific community. Could the contrarian arguments be right? I don't know. I don't have the knowledge or the skill to come to my own solid, well-founded conclusions from the "data" alone, and despite what whoever is reading this may think, neither do you. For all of us laymen what it really comes down to is who you're more likely to trust. The conservative, pro-business types among us, such as Nomander and tnbound, are going to be more likely to trust the people who say that we shouldn't do anything about it, that more government regulation is bad. The other side is going to be more likely to trust the majority of scientists who disagree with those views.
Nice come back. First attack with devious and irrelevant claims ignoring all the facts and evidence that your opponent provides, then when they come down on your unethical behavior, play the calm and collected individual so you can stir up the "He is just angry and emotional" response.
i read what you linked. it covers things already covered here, by and large.
this is not about "discrediting" you. i asked specific questions and you ignored them. so i ask again, sometimes in another way in case you didn't understand the first time. but then, again, likely obvious to all here, including yourself i can only guess.
You shotgunned me with a ton of issues. I gave some brief explanations of what I was talking about, and even told you that this information you claimed "covers things already covered here" already explains the points on your questions.
I also said that it would be better for THEM to explain it in their reports than for me to attempt to summarize it so you can nitpick on various things I might mis translate.
You then went on a discredit tirade to claim that since I could not explain every detail of the 50 some questions you posed, it was because I was avoiding the issue.
Again, READ THE LINKS.
Seriously, stop all the BS.
READ AND DECIDE!
Is that too hard for you? Or is this really just a political move on your part to try to discredit me in hopes that because I linked them, it somehow makes everything linked wrong?
Edit: better yet, what does my understanding ALL of the questions and issues you asked have to do with the fact that the ISSUE is in conflict? Does somehow my not explaining every detail to you make them wrong?
So you read those links I see. Yep? Nope? Headlines? LOL please show me my headlines.
I hope you know that your wonderful support group is the one flashing news papers and wiki links and using the suspect data as proof.
Hey folks, I swear this man didn't kill anyone, he just told me he didn't! You are brilliant. Seriously, Id give you a 1st grade report of maybe a D, but then that might upset you so we will just give you an A so you feel better.
This is a resource against the "Man-Made" Global Warming Hysteria.
"There is a clear attempt to establish truth not by scientific methods but by perpetual repetition."
- Richard S. Lindzen, Ph.D. Professor of Meteorology, MIT
The Great Global Warming Swindle (Video) (1hr 14min)
20/20: The Debate is Not Over (Video) (8min)
Penn and Teller - Bull****! - Environmental Hysteria (Video) (29min)
CBC: Documentary: Doomsday Called Off (Video) (44min)
George Carlin - The Planet is Fine (Adults Only) (Video) (8min)
More Videos and Podcasts (Videos)
The Case for Skepticism on Global Warming (Michael Crichton, M.D. Harvard)
Climate chaos? Don't believe it (Christopher Monckton, 3rd Viscount Monckton of Brenchley)
Climate of Fear (Richard S. Lindzen, Ph.D. Professor of Meteorology, MIT)
Global Warming Myths (Friends of Science)
Milankovitch Cycles (NASA)
The Global Warming Myth? (John Stossel, 20/20)
The Role of Science in Environmental Policy-Making (2005) (Michael Crichton, M.D. Harvard)
Why So Gloomy? (Richard S. Lindzen, Ph.D. Professor of Meteorology, MIT)
Al Gore "The Goracle"
"I decided I just had to call because you've printed a picture of the Earth upside down" - Al Gore, Wasington Times, 1998
Al Gore only has a B.A. in Government (no higher degree achieved, no science degrees)
The Education of Al Gore (The Washington Times)
QUOTE (The Washington Times)
Mr. Gore's high school performance on the college board achievement tests in physics (488 out of 800 "terrible," St. Albans retired teacher and assistant headmaster John Davis told The Post) and chemistry (519 out of 800 "He didn't do too well in chemistry," Mr. Davis observed) suggests that Mr. Gore would have trouble with science for the rest of his life. At Harvard and Vanderbilt, Mr. Gore continued bumbling along.
As a Harvard sophomore, scholar Al "earned" a D in Natural Sciences 6 in a course presciently named "Man's Place in Nature." That was the year he evidently spent more time smoking cannabis than studying its place among other plants within the ecosystem. His senior year, Mr. Gore received a C+ in Natural Sciences 118.
At Vanderbilt divinity school, Mr. Gore took a course in theology and natural science. The assigned readings included the apocalyptic, and widely discredited "Limits to Growth," which formed much of the foundation for "Earth in the Balance." It is said that Mr. Gore failed to hand in his book report on time. Thus, his incomplete grade turned into an F, one of five Fs Mr. Gore received at divinity school, which may well be a worldwide record.
Gore Deserves Nobel Prize for Propaganda (CNSNews)
Gore's guru disagreed (Financial Post, Canada)
The Gore Lies (National Review Online)
Hypocrite:
Hannity's America - Al Gore and Global Warming (Video) (10min)
Hannity's America - Al Gore's Gulfstream (Video) (7min)
Al Gore, Environmentalist and Zinc Miner (The Wall Street Journal)
Al Gore's Inconvenient Toxic Waste Dump (NewsMax)
Al Gore, polluter? (WorldNetDaily)
Al Gore Refuses to Take Personal Energy Ethics Pledge (US Senate Environment & Public Works Committee)
Bush's Ranch House 'Far More Eco-Friendly' Than Gore's (CNSNews)
- George W. Bush's eco-friendly ranch compared to Al Gore's energy-expending mansion = True (Snopes)
Eco-warrior Al Gore serves up endangered fish at daughter's party (Daily Mail, UK)
Gore home's energy use: 20 times average (WorldNetDaily)
- Al Gore's residence uses considerably more energy than the average American home = True (Snopes)
Gore isn't quite as green as he's led the world to believe (USA Today)
etc.. etc.. etc... headlines. cherry picking. etc.
You shotgunned me with a ton of issues. I gave some brief explanations of what I was talking about, and even told you that this information you claimed "covers things already covered here" already explains the points on your questions.
I also said that it would be better for THEM to explain it in their reports than for me to attempt to summarize it so you can nitpick on various things I might mis translate.
You then went on a discredit tirade to claim that since I could not explain every detail of the 50 some questions you posed, it was because I was avoiding the issue.
Again, READ THE LINKS.
Seriously, stop all the BS.
READ AND DECIDE!
Is that too hard for you? Or is this really just a political move on your part to try to discredit me in hopes that because I linked them, it somehow makes everything linked wrong?
Edit: better yet, what does my understanding ALL of the questions and issues you asked have to do with the fact that the ISSUE is in conflict? Does somehow my not explaining every detail to you make them wrong?
every detail? you haven't really "explained" ANYthing. that's not an attack on you. it's just what is. obviously i'm interested in what you might have to say, but you haven't really said much about your reasoning beyond pointing to this or that article you claim to have read and then name calling.
i can respect your views. if they are simply "these articles say this or that", that's fine. and i am in FULL agreement that this issue needs serious consideration. SERIOUS consideration. serious CONSIDERATION. it seems, to me, that it might help YOUR cause to provide some more of that beyond pointing to things that many of us have already evaluated and deemed suspect (and the reasoning is in previous posts in this thread if you want to go back and read some of it). if we're wrong, show us how we are wrong...
Last edited by hello-world; 10-26-2007 at 02:22 PM..
What the hell are you talking about? You may be ethical but you're definitely confusing.
The fact that you guys keep posting the same evidence over and over as proof yet never take heed to my counter to it.
Look at Bily and his "Ohh there is a consense of 928" BS. He posts me an essay, I give him a study on his essay. His essay has no sources, no evidence, nothing to back up his claims. My study contests not only his "essays" claims, but then goes ahead to explain the actual findings. He uses a news paper and then says "See, I have proof" and I use an actual study by a credible foundation and actual research scientist and he says its all garbage, that he is right.
Then, all this time I have been contesting the IPCC report. I have provided numerous links, some are just random collections of all the issues and some are SPECIFIC contests to not only the data itself, but the ethical and scientific behaviors of those making the claims.
Again, those are all blown off and I again am quoted the same darn summary of the IPCC who is in question. I am then asked to "explain" the issues and I give very brief rundowns on the issue and say "go to the link and look at the details, they can explain it better than I".
This is then used against as somehow a "lacking" in the position.
A position I might add which is nothing short of "you can't come to conclusions, there is not enough evidence and the issues are not set".
I am then claimed to be spouting lies or not "explaining" enough on issues people here who are complaining REFUSE to read or even comment on directly.
I have asked the question to ALL of you many times:
What is the Scientific Method, its purpose and why?
And this has also been completely ignored. We have people linking wiki sources and news reports like crazy, but they can't even respond with their precious wiki sources to even explain what it is?
So excuse me if I am not so "friendly" to the BS you and your colleagues have been spouting off. I won't go on some major annotation and work effort to explain every single issue in detail with links, comments, and graphs so people can ignore it like they have been doing already.
This discussion is a joke. Something I would expect from a Rosie O'donell blog filled with uneducated deviously motivated combatants. If you can not read the information I have provided and come to your own conclusions on the issues honestly, then the educational system has failed you.
every detail? you haven't really "explained" ANYthing. that's not an attack on you. it's just what is. obviously i'm interested in what you might have to say, but you haven't really said much about your reasoning beyond pointing to this or that article you claim to have read and then name calling.
i can respect your views. if they are simply "these articles say this or that", that's fine. and i am in FULL agreement that this issue needs serious consideration. SERIOUS consideration. serious CONSIDERATION. it seems, to me, that it might help YOUR cause to provide some more of that beyond pointing to things that many of us have already evaluated and deemed suspect (and the reasoning in in precious posts in this thread if you want to go back and read some of it). if we're wrong, show us how we are wrong...
And I won't. Did you not read what I said? I said I will not go into the details because I can not explain them to the level that would do them justice.
Why is it so darn hard for you to click on the links I have given and ask your own questions? Can you not think on your own?
I don't need to prove tons of evidence in this issue.
The issue is that the science is not settled. I don't need to go on combating every single piece of claim you make. I need only bring the hypothesis of man made global warming into doubt. If even ONE piece of that evidence is false, the conclusions fail.
If you believe that these issues need to be considered and rectified, then you CAN NOT come to the conclusion that we are the cause. Why? Because if the data that leads you to these conclusions is in question, how can you rely on what they might conclude?
You make my case for me. I already said in many past posts ago that I am not a climatologist, but I can think, I can question and I do understand science and how a theory is developed.
So, I read and I look at the issues and when I see a question in place that those at the IPCC can't answer, I begin to think... hmmm things are fishy here. How can they "claim" they know, when their data is inconclusive?
Those "supporting" the man made global warming idea are ignoring everything that doesn't fit into their nice little claim. That way, they can claim they are right. If it doesn't fit, well... just close your eyes and tap your heels and it will go away.
The scientific process is a fragile one. That is, if a researcher is not careful, they can easily manipulate the data to their own ends, even when they do not mean to.
As I said, read up on the Scientific Method, its principals, policy and reason for existence. Then you might understand how dangerous it is for the IPCC to be making conclusions on inconclusive findings that they can not explain to a level that accounts for all the variables.
You say why do the need to? Because this is science, and we base our findings on the facts. What can be proven, what can be shown over and over without error to be truth. Science searches for truth, not maybes or "good enoughs" or even "likely" or "very likely". They need to know, to be able to be sure, to have no factors that would question their results.
As I said, this is not the case and even you admit so. Acting on what might be is very bad. Should we convict people for crimes based on what we think "they might have done" or what "we might be able to sometimes prove with a likely (66%) certainty"? Or do we make sure that we have all the facts and we can beyond a reasonable doubt prove the case? Science is that, but even more rigid than that in its "conclusions". Anyone who tells you otherwise is lying to you or has failed to understand how science works.
This is a resource against the "Man-Made" Global Warming Hysteria.
"There is a clear attempt to establish truth not by scientific methods but by perpetual repetition."
- Richard S. Lindzen, Ph.D. Professor of Meteorology, MIT
The Great Global Warming Swindle (Video) (1hr 14min)
20/20: The Debate is Not Over (Video) (8min)
Penn and Teller - Bull****! - Environmental Hysteria (Video) (29min)
CBC: Documentary: Doomsday Called Off (Video) (44min)
George Carlin - The Planet is Fine (Adults Only) (Video) (8min)
More Videos and Podcasts (Videos)
The Case for Skepticism on Global Warming (Michael Crichton, M.D. Harvard)
Climate chaos? Don't believe it (Christopher Monckton, 3rd Viscount Monckton of Brenchley)
Climate of Fear (Richard S. Lindzen, Ph.D. Professor of Meteorology, MIT)
Global Warming Myths (Friends of Science)
Milankovitch Cycles (NASA)
The Global Warming Myth? (John Stossel, 20/20)
The Role of Science in Environmental Policy-Making (2005) (Michael Crichton, M.D. Harvard)
Why So Gloomy? (Richard S. Lindzen, Ph.D. Professor of Meteorology, MIT)
Al Gore "The Goracle"
"I decided I just had to call because you've printed a picture of the Earth upside down" - Al Gore, Wasington Times, 1998
Al Gore only has a B.A. in Government (no higher degree achieved, no science degrees)
The Education of Al Gore (The Washington Times)
QUOTE (The Washington Times)
Mr. Gore's high school performance on the college board achievement tests in physics (488 out of 800 "terrible," St. Albans retired teacher and assistant headmaster John Davis told The Post) and chemistry (519 out of 800 "He didn't do too well in chemistry," Mr. Davis observed) suggests that Mr. Gore would have trouble with science for the rest of his life. At Harvard and Vanderbilt, Mr. Gore continued bumbling along.
As a Harvard sophomore, scholar Al "earned" a D in Natural Sciences 6 in a course presciently named "Man's Place in Nature." That was the year he evidently spent more time smoking cannabis than studying its place among other plants within the ecosystem. His senior year, Mr. Gore received a C+ in Natural Sciences 118.
At Vanderbilt divinity school, Mr. Gore took a course in theology and natural science. The assigned readings included the apocalyptic, and widely discredited "Limits to Growth," which formed much of the foundation for "Earth in the Balance." It is said that Mr. Gore failed to hand in his book report on time. Thus, his incomplete grade turned into an F, one of five Fs Mr. Gore received at divinity school, which may well be a worldwide record.
Gore Deserves Nobel Prize for Propaganda (CNSNews)
Gore's guru disagreed (Financial Post, Canada)
The Gore Lies (National Review Online)
Hypocrite:
Hannity's America - Al Gore and Global Warming (Video) (10min)
Hannity's America - Al Gore's Gulfstream (Video) (7min)
Al Gore, Environmentalist and Zinc Miner (The Wall Street Journal)
Al Gore's Inconvenient Toxic Waste Dump (NewsMax)
Al Gore, polluter? (WorldNetDaily)
Al Gore Refuses to Take Personal Energy Ethics Pledge (US Senate Environment & Public Works Committee)
Bush's Ranch House 'Far More Eco-Friendly' Than Gore's (CNSNews)
- George W. Bush's eco-friendly ranch compared to Al Gore's energy-expending mansion = True (Snopes)
Eco-warrior Al Gore serves up endangered fish at daughter's party (Daily Mail, UK)
Gore home's energy use: 20 times average (WorldNetDaily)
- Al Gore's residence uses considerably more energy than the average American home = True (Snopes)
Gore isn't quite as green as he's led the world to believe (USA Today)
etc.. etc.. etc... headlines. cherry picking. etc.
Keep going down the list.
As I said, this is a comprehensive source of everything that deals with that side of the argument. Notice the link to Gorge Carlin? Its a joke, not a claim of fact or issue. Some of the things listed are in question, I agree, some are plain and legit.
If you are truly serious about the issue, then I will post this one more time.
He was responsible for the contests to the hockey model. He created the above site in order to respond to the attacks on his character and studies that contested with Hansen, others and the findings of the IPCC.
He constantly updates his continued progress of the detailed review of the data and claims made by the IPCC.
There are many areas he works on in that report. If you really listen to him, he is a pretty level headed guy who often has to temper the blog posters on the facts of the issue when they get overheated about claims and start rambling.
This is the closest you are going to get to the low level data evaluations. Some of it is a bit hard to understand (which is why I avoid trying to rehash it out here, you can understand that can you not?), but you can get the gist of what he is talking about and his points to the errors of findings are clear as well has his difficult dealings with the head author of the IPCC report.
Like I said, look at "What he has to say", browse the site and think about it compared to what you have read that claims things about man made global warming being fact, and not hypothesis.
Quote:
[SIZE=3]Short Bio: Steven McIntyre[/SIZE]
[SIZE=3]Coauthor, Corrections to the Mann et. al. (1998) Proxy Data Base and Northern Hemispheric Average Temperature Series[/SIZE]
[SIZE=3]I have worked in the mineral business for 30 years. For the last 16 years, I have been an officer or director of several small public mineral exploration companies. This has required at various times: the acquisition of exploration properties in Chile, Guyana, Venezuela and Canada; the financing of exploration and development projects, including specific responsibilities (on the company side) for the preparation of several prospectuses, qualifying reports and feasibility studies and numerous offering memoranda; general corporate management, including specific oversight of company audited financial statements, annual reports, numerous corporate disclosure documents; oversight of exploration programs; direction of several corporate re-organizations. Previous to that, I primarily worked for a large international mining company, but also worked for several years as a policy analyst at both the governments of Ontario and the government of Canada. [/SIZE]
[SIZE=3]I graduated from U.T.S. in 1965. I stood 2nd in Ontario in the then province-wide Grade 13 examinations and was 1st in Ontario (and in Canada) in the high school math contest in 1965. I studied mathematics at University of Toronto, graduating in 1969 with a B.Sc. My focus was on pure mathematics – courses like algebraic topology, group theory and differentiable manifolds. I stood 2nd in my class in 3 of 4 years. As an option, I took several economics courses, including econometrics. I was offered a graduate scholarship to study mathematical economics at MIT, but before doing so, felt that I should have broader social science background and studied PPE (Philosophy, Politics and Economics) at Oxford University on a Commonwealth Scholarship, graduating in 1971. For family reasons, I decided that I should stay in Toronto in 1971 rather than going to MIT and began work.[/SIZE]
[SIZE=3]I am married with 3 children and 2 grandchildren. I am an active squash player and once won a Gold Medal in the World Masters Games in squash doubles.[/SIZE]
[SIZE=3]The above combination of skills is relevant to the study at hand. Experience in the mineral exploration industry quickly teaches the importance of raw data, the need for careful verification of data, the need for patient examination of raw data for anomalies as well as the importance and power of well-presented graphics. It was immediately evident to me that the Mann proxy data needed to be looked at like drill core. For someone with this perspective, I also had an obviously unusual mathematical background and aptitude and was not deterred by the MBH linear algebra, which is actually rather trivial once the opaque and uninformative MBH verbiage is decoded.[/SIZE]
[SIZE=3]I am not currently an officer, director or employee of any listed public company, although I have some private business interests. My research on climate topics has not been supported by any company, but has been carried out entirely for personal interest and actually at the expense of business opportunities.[/SIZE]
Edit:
Also here is an interesting thing I already posted to someone else in this thread.
By Steve McIntyre
Here’s something I meant to post up when AR4 came out. I was reminded of this when Rob Wilson posted recently:
Lastly, lets not forget that TR based reconstructions of NH temperatures exist that do not use Bristlecone pine or Foxtail data.
Rob’s point here is very disingenuous (to use Mann-speak) since millennial reconstructions are addicted to bristlecones and foxtails. Reconstructions using them include not just MBH98-99 (which is not robust to the presence/absence as admitted by even Wahl and Ammann); but also Crowley and Lowery 2000 (two bristlecone series, including Almagre); Esper et al 2002 (two foxtail series); Mann and Jones 2003 (Mann’s PC1); Rutherford et al 2005 (Mann’s PC series flagrantly unamended); Moberg et al 2005 (3 bristlecone series); Hegerl et al (Mann’s PC1 and the Esper foxtail average); Osborn and Briffa 2006 (Mann’s PC1 and the Esper foxtail average); Juckes 2007 (the two Esper foxtail series in his Union reconstruction). In each of the studies where Mann’s incorrect PC methodology is not used, there are only a small number of series used (6-18 in the medieval portion). Can a couple of strongly HS series mixed with white or low-order red noise in a CVM procedure yield a HS recon? Readers of this blog know the answer to this, although “professional” climate scientists seem mostly unfamiliar with the statistical issues.
There are only 3 reconstructions in which foxtails and/or bristlecones do not play a role: Jones et al 1998; Briffa 2000; Briffa et al 2001; and D’Arrigo et al 2006. Without the bristlecones, Briffa et al 2001 has a pronounced Divergence Problem and the Team has taken to truncating the record in 1960 (or even in 1940 in Juckes et al). As noted elsewhere, Briffa 2000 and D’Arrigo 2006 have virtually identical medieval rosters and cannot be said to be even somewhat independent in their medieval-modern comparison: in each case, the medieval-modern relationship is changed merely by using the Polar Urals Update (instead of Briffa’s tricky Yamal substitution). In this case, the proxy was updated; the Team didn’t like the answer and so the update was never published as a separate study; they changed the proxy instead. Splicing is the main issue in Jones et al 1998.
Anyway on to the proxies shown in AR4. Here is their Box 6.4 Figure 1. I think that I’ve discussed their proxy spaghetti graph before. It shows 8 series specified only with a rather vague caption - for example, does “W USA” adequately enable a reader to locate a proxy, even if he knows that it was used in one of Mann and Jones (2003), Esper et al. (2002) and Luckman and Wilson (2005)? http://www.climateaudit.org/wp-content/uploads/2007/10/box6_461.jpg (broken link)
Box 6.4, Figure 1. The heterogeneous nature of climate during the ‘Medieval Warm Period’ is illustrated by the wide spread of values exhibited by the individual records that have been used to reconstruct NH mean temperature. These consist of individual, or small regional averages of, proxy records collated from those used by Mann and Jones (2003), Esper et al. (2002) and Luckman and Wilson (2005), but exclude shorter series or those with no evidence of sensitivity to local temperature. These records have not been calibrated here, but each has been smoothed with a 20-year filter and scaled to have zero mean and unit standard deviation over the period 1001 to 1980.
Because I know my way around the proxies, I can decode these clues. First, I knew from a previous iteration of the diagram that it’s drawn from the data versions used in Osborn and Briffa 2006 (Briffa is the IPCC lead author here). Here’s my replication of the above figure, which is pretty accurate up to nuances of color palette. In this case, I’ve taken the smoothed version of archived data from Briffa and Osborn 2006 (the smooth said to be a 20-year smooth) and then smoothed it one more time with another 20-year smooth. With only one generation of 20-year smooth, I don’t get as close a match; so it looks like IPCC has done two smooths (and only reported one.) Here is my concordance to known series (from Osborn and Briffa 2006 versions): SW Canada- Luckman-Wilson Jasper/Athabaska/Alberta; W USA- Mann PC1; W Greenland - Fisher dO18; N Sweden - Tornetrask; NW Russia - Yamal; N Russia - Taimyr; Mongolia - Jacoby Sol Dav; E Asia - Yang composite. All of these are typical stereotypes (see for example my predictions for what Hegerl et al 2006 would use or Wegman Figure 5.8).
Note that Mann’s PC1 (shown here in black) is illustrated in IPCC AR4 as large as life, sort of like Chucky - I’m baaaack. Even the explicit statements in the Wegman Report and the NAS Panel that the Mann PC1 was calculated using incorrect and biased methodology was insufficient to kill off Mann’s PC1. Actually, it’s return is not just in AR4; as I’ve noted before, it’s been used more often in multiproxy reconstructions since being discredited (Rutherford et al 2005; Osborn and Briffa 2006; Hegerl et al 2006; Juckes et al 2007) than before. It’s as though the Team has gone pro-Chucky in a seeming show of solidarity against even the NAS and Wegman reports. http://www.climateaudit.org/wp-content/uploads/2007/10/box6_462.gif (broken link)
Figure 2. My emulation of IPCC Box 6.4 Figure 1 using Osborn and Briffa 2006 data, smoothed twice with gaussian 20-year filter. Chucky is shown in heavy black.
We all hear about how IPCC reports reflect the views of stadiums full of reviewers. Given that Box 6.4 Figure 1 used Mann’s flawed PC1, do you suppose that multiple reviewers drew this defect to the attention of the section authors? Well, surprise, surprise, only one reviewer actually commented on the Briffa spaghetti graph. You’ll never guess who. And his anti-Chucky comments were disregarded by the Team. Reviewer comments in italics; IPCC response in blockquote; today’s comments in ordinary face. 6-1114 B 0:0 0:0 As a matter of prudence, it seems risky to me for IPCC to permit section lead authors to publicize and rely heavily on their own work, especially when the ink is barely dry on the work. In particular, Osborn and Briffa 2006, which is by one of the section lead authors, was published only in February 2006 and is presented in the Second Order Draft without even being presented in the First Order Draft. Nonetheless, it has been relied on to construct the important Box 6.4 Figure 1. This is risky. Osborn and Briffa 2006 uses some very questionable proxies, including the infamous Mann PC1. I have also been unable to verify some of the claimed correlations to gridcell temperature. One of the authors’ excuses is that they incorrectly cited the HadCRU2 temperature data set, while they actually used the CRUTEM2 data set and that the some of the HadCRU2 data was spurious. This hardly gives grounds for comfort. The point made in Box 6.4 Figure 1 is also argumentative. If the relative warmth of MWP and modern periods is inessential to any conclusions reached by IPCC, I would urge you to delete this Figure and related commentary. [Stephen McIntyre (Reviewer’s comment ID #: 309-11)]
Noted, MWP figure changed. Although much of the claims in the comment concerning the proxies are not share, we have chosen to change the figure somewhat to reduce reliance on a specific paper.
What did they change? They merely reduced the number of proxies in the spaghetti graph. In what meaningful sense did that “reduce reliance on a specific paper”? The caption says that Box 6.4 Figure 1 excludes “those with an ambiguous relationship to local temperature”. This is not the case as set out in some following comments. [Stephen McIntyre (Reviewer’s comment ID #: 309-38)]
Oh, btw it isn't really important but Anthony Watts is from my home town. I have worked with him on occasion in his computer interests. While I don't really care for him personally, the guy knows his stuff about weather science.
He also works with Steve in many areas of these assessments.
Note: Steve McIntyre's Climate Audit blog is currently offline, he's asked me to post this on his behalf - Anthony
James Hansen has published an online letter entitled A Light On Upstairs? The letter concludes by saying:
My apologies if the quick response that I sent to Andy Revkin and several other journalists, including the suggestion that it was a tempest inside somebody’s teapot dome, and that perhaps a light was not on upstairs, was immoderate. It was not ad hominem, though.
I haven’t seen the original letter and don’t know who the comment was about. However, it certainly sounds like an ad hominem remark and one that is highly inappropriate for a federal civil servant. I have a number of comments about other aspects of the letter. Hansen says:
Recently it was realized that the monthly more-or-less-automatic updates of our global temperature analysis (Pubs.GISS: Abstract of Hansen et al. 2001) had a flaw in the U.S. data. In that (2001) update of the analysis method (originally published in our 1981 Science paper – Pubs.GISS: Abstract of Hansen et al. 1981) we included improvements that NOAA had made in station records in the U.S., their corrections being based mainly on station-by-station information about station movement, change of time-of-day at which max-min are recorded, etc. Unfortunately, we didn’t realize that these corrections would not continue to be readily available in the near-real-time data streams. The same stations are in the GHCN (Global Historical Climatology Network) data stream, however, and thus what our analysis picked up in subsequent years was station data without the NOAA correction. Obviously, combining the uncorrected GHCN with the NOAA-corrected records for earlier years caused jumps in 2001 in the records at those stations, some up, some down (over U.S. only).
The first sentence “it was realized” certainly makes it sound like they identified the problem themselves (a position not taken in the webpage itself.) Moving on, Hansen says that the USHCN “corrections would not continue to be readily available in the near-real-time data streams”. If GISS is using USHCN adjusted data (as appears to be case from the description in Hansen et al 2001 and the website), this claim is incorrect. Readers in doubt of this may go to the USHCN website ftp://ftp.ncdc.noaa.gov/pub/data/ushcn/ (broken link) ; the file hcn_doe_mean_data.Z contains three versions of USHCN data, included the version that Hansen says is unavailable. This file was most recently updated on March 1, 2007 and, for the majority of sites, contains adjusted USHCN data up to Oct 2006. At present, GISS has only updated USHCN records to March 2006. Thus, not only are the adjusted USHCN versions available, they are available more recently than presently incorporated into the GISS temperature calculations.
Data from the other major station archive (GHCN) can be downloaded from ftp://ftp.ncdc.noaa.gov/pub/data/ghcn/v2 (broken link) . The GHCN raw data set and v2.mean.Z and the adjusted data set v2.mean_adj.Z are both updated all the time, most recently Aug 11, 2007. In the version that I downloaded in June, the USHCN record only went to March 2006, the period of the GISS record. However, readers can confirm that both the GHCN raw and GHCN adjusted versions have been archived concurrently and that the switch from one version to another was not required because of version unavailability.
In this context, the form of the present layer of GISS corrections seems extremely rushed and inappropriate. If GISS wishes to start with GHCN adjusted data, then it’s easy to do so. Just use it. There’s no need to estimate the required correction to undo the effect of switching data sets. Just stick with the data set that they started with. Far simpler and cleaner than throwing another “correction” into the mix - a correction which has required overwriting their entire input data for all 1221 USHCN stations prior to 2000. 1998
Hansen goes on to say:
Also our prior analysis had 1934 as the warmest year in the U.S. (see the 2001 paper above), and it continues to be the warmest year, both before and after the correction to post 2000 temperatures. However, as we note in that paper, the 1934 and 1998 temperature are practically the same, the difference being much smaller than the uncertainty.
Unfortunately, this statement is again untrue. The data online at GISS http://data.giss.nasa.gov/gistemp/graphs/Fig.D.txt immediately prior to the changes showed 1998 as the warmest year (admittedly by a negligible margin of 0.01 deg C), but still the warmest, contrary to the claim made here. GISS has overwritten this data file and did not preserve an online version of the uncorrected data that they had previously shown. However, by chance, I happened to have had the data in my R-session when GISS made the changes and I assure readers that the GISS data shown here purported to show that 1998 was the “warmest”. Hansen may have been for 1934 before he was against it. But now that he’s for 1934 once again, he can’t say that he was for it all along.
In the NASA press release in 1999 , Hansen was very strongly for 1934. He said then:
The U.S. has warmed during the past century, but the warming hardly exceeds year-to-year variability.Indeed, in the U.S. the warmest decade was the 1930s and the warmest year was 1934.
This was illustrated with the following depiction of US temperature history, showing that 1934 was almost 0.6 deg C warmer than 1998.
From a Hansen 1999 News Release: http://www.giss.nasa.gov/research/briefs/hansen_07/fig1x.gif
However within only two years, this relationship had changed dramatically. In Hansen et al 2001 (referred to in the Lights On letter), 1934 and 1998 were in a virtual dead heat with 1934 in a slight lead. Hansen et al 2001 said
The U.S. annual (January-December) mean temperature is slightly warmer in 1934 than in 1998 in the GISS analysis (Plate 6)… the difference between 1934 and 1998 mean temperatures is a few hundredths of a degree.
From Hansen et al 2001 Plate 2. Note the change in relationship between 1934 and 1998.
Between 2001 and 2007, for some reason, as noted above, the ranks changed slightly with 1998 creeping into a slight lead.
The main reason for the changes were the incorporation of an additional layer of USHCN adjustments by Karl et al overlaying the time-of-observation adjustments already incorporated into Hansen et al 1999. Indeed, the validity and statistical justification of these USHCN adjustments is an important outstanding issue. Arctic Changes
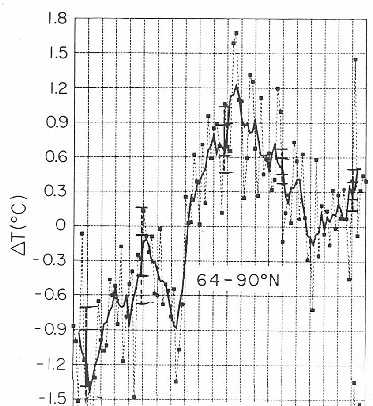
Changes in the relationship of the 1930s to recent values have not merely been made in the United States. In the Arctic, there has also been a progressive change in the relationship of temperatures in the 1930s to recent temperatures, a point previously discussed at CA here . Hansen and Lebedeff 1987 showed very warm 1930s in the Arctic, as shown in the excerpted figure showing the 64-90N temperature history.
Excerpt from Hansen and Lebedeff 1987, showing 64-90N temperature. The horizontal plot is from 1880 to 1985 (as seen in the full Figure 7 of the original article shown here (http://www.climateaudit.org/wp-content/uploads/2007/03/scan3.jpg - broken link) )
The graphic below compares the most recent version of the same graph (plotted from online data at GISS), marking two bold points for 1937 and 1938 obtained from the printed information in Hansen and Lebedeff 1987 (which prints out the data now shown online). For both 1937 and 1938, the GISS estimates have been reduced by approximately 0.4 deg C. Despite recent warming, 2005 was the first year in which 64-90N values exceeded the former 1938 value - see dotted line - (indeed, 2003 was the first year that exceeded the “adjusted” 1938 value). While there are undoubtedly “good” reasons for these adjustments (and I am not here arguing the point one way or the other), the net effect of the adjustments has been to consistently lower temperatures in the 1930s relative to more recent values. Whether these adjustments prove justified or not, modifications to the temperature record of this magnitude surely warrant the most careful scrutiny before turning the “lights out upstairs.”
64-90N from Hansen 64-90N zone downloaded today. Thick - 5 year running mean (often used by Hansen). Points are selected values from Hansen and Lebedeff 1987. Dotted line compares 1938 value from Hansen and Lebedeff 1987 to other values.
Posted by Anthony Watts on August 11, 2007 08:40 PM | Permalink
Please register to post and access all features of our very popular forum. It is free and quick. Over $68,000 in prizes has already been given out to active posters on our forum. Additional giveaways are planned.
Detailed information about all U.S. cities, counties, and zip codes on our site: City-data.com.

 Please register to participate in our discussions with 2 million other members - it's free and quick! Some forums can only be seen by registered members. After you create your account, you'll be able to customize options and access all our 15,000 new posts/day with fewer ads.