Please register to participate in our discussions with 2 million other members - it's free and quick! Some forums can only be seen by registered members. After you create your account, you'll be able to customize options and access all our 15,000 new posts/day with fewer ads.
S&P/Case-Shiller Home Price Index of 20 major housing markets released Tuesday. Prices were up 1.3% from April, and 4.6% from 12 months earlier.
Only one of the 20 metro areas, Las Vegas, reported a price decline for May, with a 0.5% loss. Minneapolis had the largest spike: prices jumped 2.8% and were up 11.6% over the prior 12 months.
San Francisco had the largest year-over-year gain, 18.3% higher than May 2009. San Diego, at 12.4%, and Los Angeles, at 9.7%, have also posted healthy year-over-year gains.
In a way, the index may understate its positive results. It counts all sales, including distressed properties. Those have become a major component of the market, with short sales and bank repossessions accounting for close to a third of all sales.
In 1999, median price was $140k, If you compounded that at 3%/year you would be at $175k today. Today the median home price is $190k, so we are not too far off. Less than 10% decline from here, which is what some analysts predict before the bottom. EDIT: The national median home price today is $165k (4Q08 was $190k) so it looks like we are past the bottom? The stock market today thinks so too based on BofA and Wells Fargo up 30-36% in one day on earnings outlook.
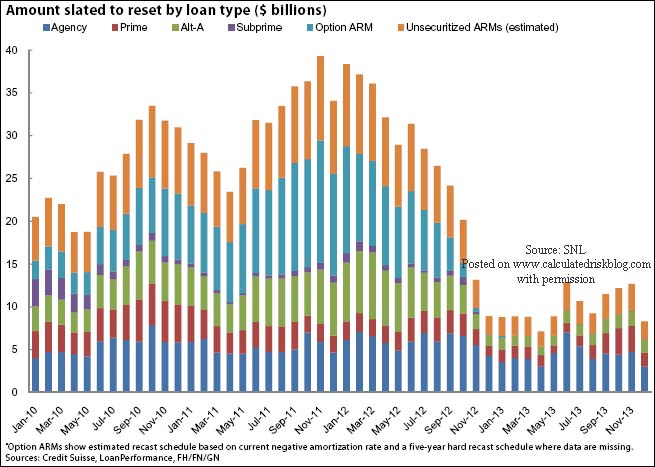
Here's the updated chart as of March, 2010. Looks to peak in 2012 now.
I'm not an expert on these charts, as I have never seen them until about a year ago and do not study them, so help me if I am wrong...but isn't that how the chart should always look? The bubble just keeps extending out two years? So, next year, wouldn't the bubble be in 2013?
I'm not an expert on these charts, as I have never seen them until about a year ago and do not study them, so help me if I am wrong...but isn't that how the chart should always look? The bubble just keeps extending out two years? So, next year, wouldn't the bubble be in 2013?
Not sure if you're making a joke about "extend and pretend"-- which is what has pushed the peak further out, but assuming you're serious....
There shouldn't be a continuing bubble for loan recasts, since loans like this are hard to get these days. So if the built-in reset is five years and no one has been extending such loans (in any comparable numbers to bubble years) since 2008-- you wouldn't see a bubble of resets/recasts anywhere beyond 2013.
FYI note the difference between resets and recasts: Resets are when the loan was naturally scheduled to set to something other than the "teaser" rate. Recasts are when borrowers have been paying so little each month (taking the "option" of interest only or less) that the loan balance GROWS till it triggers a normal payment that includes principal and interest-- which is higher than the original principal and interest payment would've been since now the loan balance is bigger (insidious, yes?).
The rate of resets vs. recasts is hard to pin down apparently because no one can exactly track how many borrowers are taking the option of insidious negative amortization vs. paying till the full 5yr reset vs. getting out of the loan entirely into a fixed rate (if they can qualify) before the whole thing explodes out from under them.
Hope this makes sense. Can't claim 100% accuracy because I'm an English major by nature who's only been forced to learn this stuff through circumstances.
Thanks to the good old governmental interventions “Hamp, Low interest rates, Fanny and Freddy maa” in their bogus ( in realty these programs were to keep them looking good and their buddy bankers from having to devalue their trillions in real estate inventory’s ) attempts to keep housing market stable we have yet feel the full realty of this crash. Only Once all these program stop and interest rates get back to normal you will see the full crash come to light.
In other words we are no were near the bottom !!
Please register to post and access all features of our very popular forum. It is free and quick. Over $68,000 in prizes has already been given out to active posters on our forum. Additional giveaways are planned.
Detailed information about all U.S. cities, counties, and zip codes on our site: City-data.com.

 Please register to participate in our discussions with 2 million other members - it's free and quick! Some forums can only be seen by registered members. After you create your account, you'll be able to customize options and access all our 15,000 new posts/day with fewer ads.