Please register to participate in our discussions with 2 million other members - it's free and quick! Some forums can only be seen by registered members. After you create your account, you'll be able to customize options and access all our 15,000 new posts/day with fewer ads.
I would strongly disagree, for the following reasons:
1. You can't take the city proper in isolation, but the entire metro area. SD has about 3 million (5 million if you include TJ) vs the Bay Area's 8-9 million.
2. SF downtown is far more bustling than down SD. SF feels like a small version of Manhattan. SD, not so much.
3. The Bay Area has 6 professional sports teams (will still be 5 when the Raiders leave) vs SD's 1
4. The Bay Area has 2 Pac 12 college sports teams among others. What is SDSU? Mountain West?
5. The Bay Area is the 5th largest media market vs about #16 or #18 for SD
6. The Bay Area is home to all the FAANG tech companies (Amazon has a large presence here as well). SD's claim to claim is Qualcomm. Not really relevant anymore.
7. Three international airports including one major hub in the Bay Area vs barely an international airport for SD.
8. Aside from the size difference, the Bay Area has more of a career focus/intellectual atmosphere. It feels like the East Coast transplanted in California. SD is more relaxed with the surfer vibe. One could argue its a better place to retire, but certainly not of greater importance regionally or internationally.
9. News channels in SD feel very amateurish vs much more professional in the Bay Area. Its really night and day.
10. Much more international food scene and top notch food options in the Bay Area (although SD does have better Mexican food).
By the way, I lived in SD for several years before the Bay Area. I like SD as a place to visit and possibly retire. But, please don't even try to pretend SD is on par with the Bay Area in terms of importance. That is really a joke.
You are comparing a CSA spread out over a massive area to a much more compact metro area, while using the super-original, never seen before "SF is like Manhattan" analogy I see.
The fact is that San Francisco is much closer to San Diego in terms of importance than it is to Los Angeles, something I"m sure Bay Areans don't want to hear. Even if you give "San Francisco" the most generous CSA population estimate of NINE MILLION people, well, that is still millions and millions shy of just the urban area of Los Angeles.
I gotta say, what Pirate said is pretty spot on. CA IS ridiculous, but our air quality is a LOT LOT better than it was before regulations came into play. Now it's just a money grab though, and it sucks.
You are comparing a CSA spread out over a massive area to a much more compact metro area, while using the super-original, never seen before "SF is like Manhattan" analogy I see.
The fact is that San Francisco is much closer to San Diego in terms of importance than it is to Los Angeles, something I"m sure Bay Areans don't want to hear. Even if you give "San Francisco" the most generous CSA population estimate of NINE MILLION people, well, that is still millions and millions shy of just the urban area of Los Angeles.
Actually, the Bay Area punches well above its weight, due to a higher per-capita income vs LA or SD:
LA metro (~18M) - GDP - $1.074T
SF/Oakland/Hayward (~5M) - $518B
San Jose/Sunnyvale/Santa Clara (~3M) - $275B
You are comparing a CSA spread out over a massive area to a much more compact metro area, while using the super-original, never seen before "SF is like Manhattan" analogy I see.
The fact is that San Francisco is much closer to San Diego in terms of importance than it is to Los Angeles, something I"m sure Bay Areans don't want to hear. Even if you give "San Francisco" the most generous CSA population estimate of NINE MILLION people, well, that is still millions and millions shy of just the urban area of Los Angeles.
Your population numbers are completely exaggerated in favor of the Bay Area.
Here is the US Government's accounting of urban areas in the US for 2016. This shows the Bay Area has a combined urban area of 4.9 million to San Diego's 2.9M. Not exactly 8 or 9 million in the Bay Area as you claim, unless you count towns like Stockton or other far out locales that don't count as part of the contiguous urban area.
Urban areas of the United States of America[1]
Rank Name[Note 1] Population
(2010 Census) Land Area
(km²) Land Area
(sq mi) Density
(Population / km²) Density
(Population / sq mi) Central City
Population
(2010 Census) Central City
Pop % of
Urban Area Central City
Land Area Central City
Land Area % of
Urban Area
1 New York--Newark, NY—NJ—CT-PA 18,351,295 8,936.0 3,450.2 2,053.6 5,318.9 8,175,133 44.5% 302.643 8.8%
2 Los Angeles--Long Beach--Anaheim, CA 12,150,996 4,496.3 1,736.0 2,702.5 6,999.3 3,792,621 31.2% 468 27%
3 Chicago, IL—IN—WI 8,608,208 6,326.7 2,442.8 1,360.6 3,524.0 2,695,598 31.3% 227 9.3%
4 Miami, FL 5,502,379 3,208.0 1,238.6 1,715.2 4,442.4 399,457 7.3% 36 2.9%
5 Philadelphia, PA—NJ—DE—MD 5,441,567 5,131.7 1,981.4 1,060.4 2,746.4 1,526,006 28% 134 6.8%
6 Dallas--Fort Worth--Arlington, TX 5,121,892 4,607.9 1,779.1 1,111.5 2,878.9 1,197,816 23.4% 340 19.1%
7 Houston, TX 4,944,332 4,299.4 1,660.0 1,150.0 2,978.5 2,099,451 42.5% 639 38.5%
8 Washington, DC—VA—MD 4,586,770 3,423.3 1,321.7 1,339.9 3,470.3 681,170 14.9% 61 4.6%
9 Atlanta, GA 4,515,419 6,851.4 2,645.4 659.0 1,706.9 420,003 9.3% 133 5%
10 Boston, MA—NH—RI-CT 4,181,019 4,852.2 1,873.5 861.7 2,231.7 617,594 14.8% 48 2.6%
11 Detroit, MI 3,734,090 3,463.2 1,337.2 1,078.2 2,792.5 713,777 19.1% 138 10.3%
12 Phoenix--Mesa, AZ 3,629,114 2,969.6 1,146.6 1,222.1 3,165.2 1,445,632 40% 517 45.1% 13 San Francisco--Oakland, CA 3,281,212 1,356.2 523.6 2,419.5 6,266.4 805,235 24.5% 46.9 9%
14 Seattle, WA 3,059,393 2,616.7 1,010.3 1,169.2 3,028.2 608,660 20% 83.9 8.3% 15 San Diego, CA 2,956,746 1,896.9 732.4 1,558.7 4,037.0 1,307,402 44.2% 325.2 44.4%
16 Minneapolis--St. Paul, MN 2,650,890 2,646.5 1,021.8 1,001.7 2,594.3 382,578 14.4% 54.9 5.4%
17 Tampa--St. Petersburg, FL 2,441,770 2,478.6 957.0 985.1 2,551.5 335,709 13.7% 113.4 11.8%
18 Denver--Aurora--Lakewood, CO 2,374,203 1,730.0 668.0 1,372.4 3,554.4 600,158 25.2% 153.3 22.9%
19 Baltimore, MD 2,203,663 1,857.1 717.0 1,186.6 3,073.3 620,961 28.2% 80.9 11.3%
20 St. Louis, MO—IL 2,150,706 2,392.2 923.6 899.0 2,328.5 319,294 14.8% 61.9 6.7%
21 San Juan, PR 2,148,346 2,244.7 866.7 957.1 2,478.8
22 Riverside--San Bernardino, CA 1,932,666 1,411.5 545.0 1,369.3 3,546.4
23 Las Vegas--Henderson, NV 1,886,011 1,079.6 416.8 1,746.9 4,524.5 583,756 31% 135.8 32.6%
24 Portland, OR—WA 1,849,898 1,358.1 524.4 1,362.1 3,527.8 583,776 31.6% 133 25.4%
25 Cleveland, OH 1,780,673 1,999.4 772.0 890.6 2,306.7 396,815 22.3% 77.7 10%
26 San Antonio, TX 1,758,210 1,546.5 597.1 1,136.9 2,944.6 1,327,407 75.5% 460.9 77.2%
27 Pittsburgh, PA 1,733,853 2,344.4 905.2 739.6 1,915.5 305,704 17.6% 55.4 6.1%
28 Sacramento, CA 1,723,634 1,219.8 471.0 1,413.0 3,659.7 466,488 27.1% 97.9 20.8% 29 San Jose, CA 1,664,496 740.7 286.0 2,247.2 5,820.3 945,942 56.8% 177.5 62%
30 Cincinnati, OH—KY—IN 1,624,827 2,040.2 787.7 796.4 2,062.6 296,943 18.3% 78 9.9%
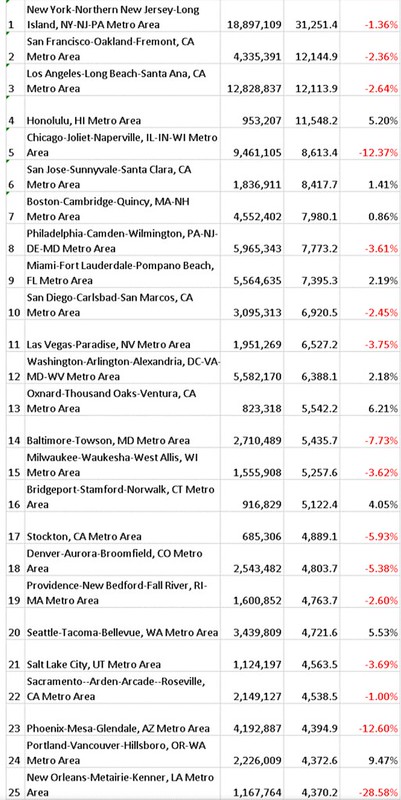
Here is a similar study showing the weighted density of metro areas in the US. This one is a bit more generous, but still only provides a true urban area population of 6.1M. This would help to explain why the Bay Area feels so much smaller than places like LA, or Southern California in general.
2010 data
Rank Metro Population Weighted Density Pop Change%
Also worth noting that the Bay Area counts every conceivable town anywere in reach, however San Diego doesn't count a lot of joined areas (like Temecula, Murrieta, etc) because they fall into the LA area's numbers as LA claims all of Riverside county.
Your population numbers are completely exaggerated in favor of the Bay Area. Here is the US Government's accounting of urban areas in the US for 2016. This shows the Bay Area has a combined 4.9 million to San Diego's 2.9M. Not exactly 8 or 9 million in teh Bay Area as you claim, unless you count towns like Stockton or other far out locales that don't count as part of the contiguous urban area.
Urban areas of the United States of America[1]
Rank Name[Note 1] Population
(2010 Census) Land Area
(km²) Land Area
(sq mi) Density
(Population / km²) Density
(Population / sq mi) Central City
Population
(2010 Census) Central City
Pop % of
Urban Area Central City
Land Area Central City
Land Area % of
Urban Area
1 New York--Newark, NY—NJ—CT-PA 18,351,295 8,936.0 3,450.2 2,053.6 5,318.9 8,175,133 44.5% 302.643 8.8%
2 Los Angeles--Long Beach--Anaheim, CA 12,150,996 4,496.3 1,736.0 2,702.5 6,999.3 3,792,621 31.2% 468 27%
3 Chicago, IL—IN—WI 8,608,208 6,326.7 2,442.8 1,360.6 3,524.0 2,695,598 31.3% 227 9.3%
4 Miami, FL 5,502,379 3,208.0 1,238.6 1,715.2 4,442.4 399,457 7.3% 36 2.9%
5 Philadelphia, PA—NJ—DE—MD 5,441,567 5,131.7 1,981.4 1,060.4 2,746.4 1,526,006 28% 134 6.8%
6 Dallas--Fort Worth--Arlington, TX 5,121,892 4,607.9 1,779.1 1,111.5 2,878.9 1,197,816 23.4% 340 19.1%
7 Houston, TX 4,944,332 4,299.4 1,660.0 1,150.0 2,978.5 2,099,451 42.5% 639 38.5%
8 Washington, DC—VA—MD 4,586,770 3,423.3 1,321.7 1,339.9 3,470.3 681,170 14.9% 61 4.6%
9 Atlanta, GA 4,515,419 6,851.4 2,645.4 659.0 1,706.9 420,003 9.3% 133 5%
10 Boston, MA—NH—RI-CT 4,181,019 4,852.2 1,873.5 861.7 2,231.7 617,594 14.8% 48 2.6%
11 Detroit, MI 3,734,090 3,463.2 1,337.2 1,078.2 2,792.5 713,777 19.1% 138 10.3%
12 Phoenix--Mesa, AZ 3,629,114 2,969.6 1,146.6 1,222.1 3,165.2 1,445,632 40% 517 45.1% 13 San Francisco--Oakland, CA 3,281,212 1,356.2 523.6 2,419.5 6,266.4 805,235 24.5% 46.9 9%
14 Seattle, WA 3,059,393 2,616.7 1,010.3 1,169.2 3,028.2 608,660 20% 83.9 8.3% 15 San Diego, CA 2,956,746 1,896.9 732.4 1,558.7 4,037.0 1,307,402 44.2% 325.2 44.4%
16 Minneapolis--St. Paul, MN 2,650,890 2,646.5 1,021.8 1,001.7 2,594.3 382,578 14.4% 54.9 5.4%
17 Tampa--St. Petersburg, FL 2,441,770 2,478.6 957.0 985.1 2,551.5 335,709 13.7% 113.4 11.8%
18 Denver--Aurora--Lakewood, CO 2,374,203 1,730.0 668.0 1,372.4 3,554.4 600,158 25.2% 153.3 22.9%
19 Baltimore, MD 2,203,663 1,857.1 717.0 1,186.6 3,073.3 620,961 28.2% 80.9 11.3%
20 St. Louis, MO—IL 2,150,706 2,392.2 923.6 899.0 2,328.5 319,294 14.8% 61.9 6.7%
21 San Juan, PR 2,148,346 2,244.7 866.7 957.1 2,478.8
22 Riverside--San Bernardino, CA 1,932,666 1,411.5 545.0 1,369.3 3,546.4
23 Las Vegas--Henderson, NV 1,886,011 1,079.6 416.8 1,746.9 4,524.5 583,756 31% 135.8 32.6%
24 Portland, OR—WA 1,849,898 1,358.1 524.4 1,362.1 3,527.8 583,776 31.6% 133 25.4%
25 Cleveland, OH 1,780,673 1,999.4 772.0 890.6 2,306.7 396,815 22.3% 77.7 10%
26 San Antonio, TX 1,758,210 1,546.5 597.1 1,136.9 2,944.6 1,327,407 75.5% 460.9 77.2%
27 Pittsburgh, PA 1,733,853 2,344.4 905.2 739.6 1,915.5 305,704 17.6% 55.4 6.1%
28 Sacramento, CA 1,723,634 1,219.8 471.0 1,413.0 3,659.7 466,488 27.1% 97.9 20.8% 29 San Jose, CA 1,664,496 740.7 286.0 2,247.2 5,820.3 945,942 56.8% 177.5 62%
30 Cincinnati, OH—KY—IN 1,624,827 2,040.2 787.7 796.4 2,062.6 296,943 18.3% 78 9.9%
Here is a similar study showing the weighted density of metro areas in the US. This one is a bit more generous, but still only provides a true urban area population of 6.1M. This would help to explain why the Bay Area feels so much smaller than places like LA, or Southern California in general.
2010 data
Rank Metro Population Weighted Density Pop Change%
Also worth noting that tge Bay Area counts every conceivable town anywere in reach, however San Diego doesn't count a lot of commuter areas (like Temecula, Murrieta, etc) because they fall into the LA area's numbers. .
You can't really separate SF and SJ into separate metro areas:
1. Same media market
2. Many people commute from SF down to the valley and vice versa
3. Public transportation is connected between the two cities (e.g., Caltrain, soon to be BART extension to downtown SJ).
4. There is no break in populated area. There's a clear break between Escondido/Temecula or Oceanside/San Clemente
Using your logic of including Temecula would be like me saying that Sacramento should be lumped into the Bay Area's population, which it's not.
I think you missed the larger point, but since we are arguing about Temecula, Temecula developed from the ground-up entirely as a San Diego exurb for people that wanted to live somewhere cheaper. Sacramento was always it's own city, whether you want to argue that there are commuters or not.
Spending any time at all on the interstates during rush hours will discourage anyone’s notion that San Diego has a small town feel. The beach town mystique vanished years ago.
You can't really separate SF and SJ into separate metro areas:
1. Same media market
2. Many people commute from SF down to the valley and vice versa
3. Public transportation is connected between the two cities (e.g., Caltrain, soon to be BART extension to downtown SJ).
4. There is no break in populated area. There's a clear break between Escondido/Temecula or Oceanside/San Clemente
Using your logic of including Temecula would be like me saying that Sacramento should be lumped into the Bay Area's population, which it's not.
Yes you can, the census bureau does. As for the rest of your points
1. LA and the Inland Empire are separate MSA, but the same media market
2. People commute from the Inland Empire to SD, OC, & LA. Many commute from SD to OC
3. Oceanside is connected to OC, LA, and IE via the Metrolink
4. That’s because of Camp Pendleton and the topography along the 15. If the land along the 15 was a big basin like Temecula it would definately be more developed. I won’t even go there If Camp Pendleton didn’t exist. Personally I’m glad they both are how they are.
Actually, SJ metro is 1.95 million, not 1.66 million. It's just one county plus very unpopulated rural county.
Please register to post and access all features of our very popular forum. It is free and quick. Over $68,000 in prizes has already been given out to active posters on our forum. Additional giveaways are planned.
Detailed information about all U.S. cities, counties, and zip codes on our site: City-data.com.

 Please register to participate in our discussions with 2 million other members - it's free and quick! Some forums can only be seen by registered members. After you create your account, you'll be able to customize options and access all our 15,000 new posts/day with fewer ads.