La Niña
December 26, 2010
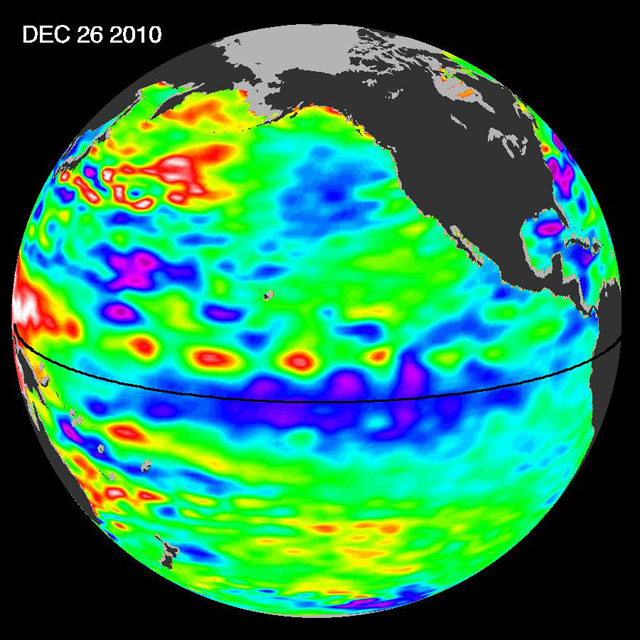
The current state of this season's La Niña is shown in this Ocean Surface Topography Mission (OSTM)/Jason-2 satellite image of the Pacific Ocean, based on the average of 10 days of data centered on Dec. 26, 2010.
The new image depicts places where the Pacific sea-surface height is higher (warmer) than normal as yellow and red, while places where the sea surface is lower (cooler) than normal are shown in blue and purple. Green indicates near-normal conditions. Sea-surface height is an indicator of how much of the sun's heat is stored in the upper ocean.
The La Niña cool waters stretch from the eastern to the central Pacific Ocean.
"This La Niña has strengthened for the past seven months, and is one of the most intense events of the past half century ," said Climatologist Bill Patzert of NASA's Jet Propulsion Laboratory, Pasadena, Calif. "It is already impacting weather and climate around the planet."

 Please register to participate in our discussions with 2 million other members - it's free and quick! Some forums can only be seen by registered members. After you create your account, you'll be able to customize options and access all our 15,000 new posts/day with fewer ads.


