month = avg hi / avg lo // record hi / record lo // avg precip
jan = 23 / 7 // 52 / -40 // 0.63
feb = 28 / 11 // 53 / -42 // 0.74
mar = 37 / 18 // 55 / -30 // 0.57
apr = 49 / 28 // 68 / -8 // 0.47
may = 60 / 36 // 80 / 14 // 0.77
jun = 67 / 44 // 90 / 29 // 1.51
jul = 70 / 49 // 87 / -14 // 2.31
aug = 68 / 46 // 98 / 27 // 2.58
sep = 59 / 39 // 76 / -14 // 2.87
oct = 43 / 26 // 67 / -14 // 1.84
nov = 29 / 14 // 56 / -25 // 1.23
dec = 25 / 9 // 51 / -38 // 1.09
source =
Average Weather for Wasilla, AK - Temperature and Precipitation
I have NO IDEA what is going on with that July record low of -14!

I thought it may very well be a typo, but Wikipedia says the same thing for the record low of that month!
Wasilla, Alaska - Wikipedia, the free encyclopedia (Note the Wikipedia's information, especially regarding record highs during the summer, varies some from what weather.com says).
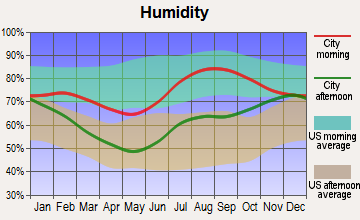
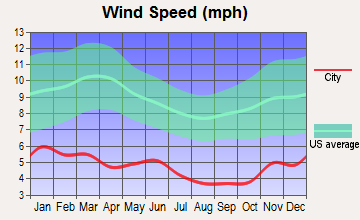
And now for the C-D charts:
//www.city-data.com/city/Wasilla-Alaska.html
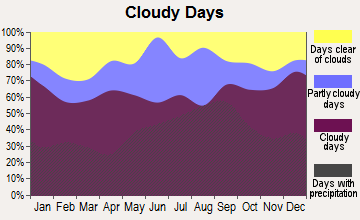
Not sure what the actual average annual sunshine hours are for Wasilla.

 Please register to participate in our discussions with 2 million other members - it's free and quick! Some forums can only be seen by registered members. After you create your account, you'll be able to customize options and access all our 15,000 new posts/day with fewer ads.


