Please register to participate in our discussions with 2 million other members - it's free and quick! Some forums can only be seen by registered members. After you create your account, you'll be able to customize options and access all our 15,000 new posts/day with fewer ads.
but thats not whats the data from malraver says. It says average high was 17.3 celsius, wich i think is almost exactly the average high for august, while the low was like 3 celsius ABOVE average. So it was, indeed, an above average month if we take in count the data malraver posted.
Yes, I hadn't read marlaver's post when I posted mine, sorry. Well, the ones I posted were the calculated avgs based on the Ogimet data. Maybe I copied some of the data wrongly? I'll do them again.
Where do you get the data to do a summary? I don't know how to do those tables either I tried it on wikipedia and it dosn't let you edit it.
I use my local newspaper daily reports. Not fool proof though. I missed a few days for July, and ended up with the wrong maximum (13.9C against the official 14.7C maximum)
Don't know about the wiki box, but there was a discussion on it in a climate summary thread, from earlier this year.
Air temperature: 15,7°C / 60°F (average is 15,8°C).
Air temperature max and min: 27,3°C / 80.6°F and 1,5°C / 33.8°F.
Precipitation: 88 mm (average is 79 mm).
Sunshine: 204 h (average is 235 h).
Slightly rainier and cloudier than normal. Still way too sunny for me tbh.
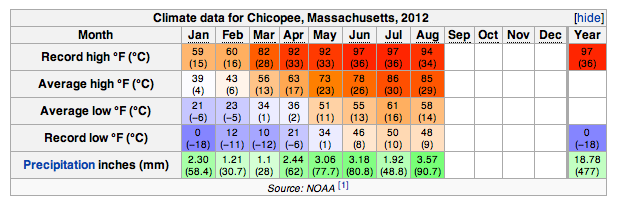
My turn to post a weatherbox summary. I have two local stations nearby. The Chicopee one tends to read more extreme temperatures, particularly nights, though this year it hasn't seemed to by much. I can't find any observations from the Amherst one; just monthly data which are posted several months afterward. It does have snowfall and precipitation days.
The data past June on the Amherst box isn't real, didn't delete some of the original wiki data. I'm a bit shocked how arid it's been this year, though I think the Amherst station is more trustworthy for precipitation data. And here's the max, mean and min dewpoint of Chicopee so far this year (°F):
Jan: 47/21/-9
Feb: 42/21/-4
Mar: 59/33/-6
Apr: 59/32/7
May: 73/53/30
Jun: 75/56/45
Jul: 75/62/44
Aug: 77/62/44
Sep: 74 (don't think it will go higher than that this month)
Good way to see how our weather patterns change. Summer was definitely more humid than usual. The highest dewpoints were typically associated with rainstorms rather than extremely hot weather. The 77°F happened around sunset. Mean dewpoint was within a few degrees of the average low, during the summer tended to run slightly higher than the average low.
Does the Met Office website not provide day-by-day observations for each month? If not the Weather Underground website can usually provide you with decent monthly stats.
Please register to post and access all features of our very popular forum. It is free and quick. Over $68,000 in prizes has already been given out to active posters on our forum. Additional giveaways are planned.
Detailed information about all U.S. cities, counties, and zip codes on our site: City-data.com.

 Please register to participate in our discussions with 2 million other members - it's free and quick! Some forums can only be seen by registered members. After you create your account, you'll be able to customize options and access all our 15,000 new posts/day with fewer ads.