Welcome to City-Data.com Forum!
U.S. CitiesCity-Data Forum Index
Go Back   City-Data Forum > General Forums > Weather
 [Register]
Please register to participate in our discussions with 2 million other members - it's free and quick! Some forums can only be seen by registered members. After you create your account, you'll be able to customize options and access all our 15,000 new posts/day with fewer ads.
View detailed profile (Advanced) or search
site with Google Custom Search

Search Forums  (Advanced)
Reply Start New Thread
 
Old 04-03-2013, 02:10 PM
 
Location: Near the Coast SWCT
83,518 posts, read 75,307,397 times
Reputation: 16619

Advertisements

I caught an Error with NWS Boston. I’m kinda pissed at their response.

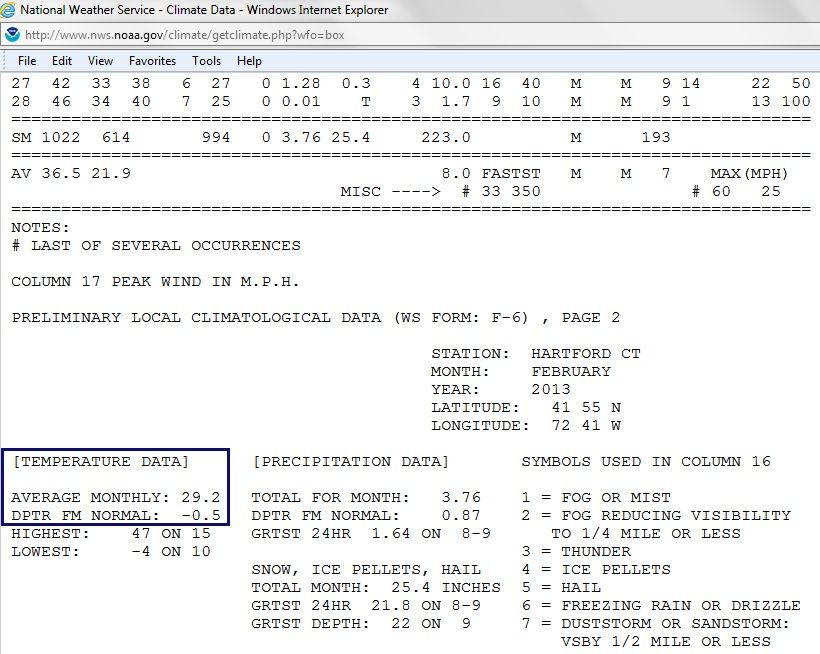
In short.. February 2013 mean temp for BDL (Windsor Locks, CT) was 29.2°. As seen on their F6 data here. National Weather Service Climate

They list it as -.5° below normal. But when you look at the 1981-2010 normal February temp, its actually 30.7°, NOT the 29.7° they claim, which would mean February was -1.5° below normal. A full degree difference!

I contacted NWS Boston for their error showing this, And here’s their response: “For monthly climate normals, it is not a process of averaging monthly temperatures over a 30 year period”

Seriously??

So I took a step further and looked at every month from their F6 Data for BDL in 2012 and WHALLAH. They all pretty much MATCH the 30yr normal but meanwhile they are making an excuse for the below normal month of February???

Here’s how it looks compared to each other.
Local Climatological Data Publication - Select Month
National Weather Service Climate

Can you imagine how skewed the numbers would look if this is happening all over? Of course it would look warmer!

Screen shot (before they change it) of February 2013


And here's how it looks compared to eachother... Why did they decide to fudge the February numbers???

Reply With Quote Quick reply to this message

 
Old 04-03-2013, 04:22 PM
 
Location: Near the Coast SWCT
83,518 posts, read 75,307,397 times
Reputation: 16619
Oh my God…


They used 29.7 February 2012 so instead of it being 6 degrees above normal, it should have been 5 degrees above normal. That 1 degrees is HUGE when you start blending all data together ESPECIALLY if other stations are doing this too. No wonder why 2012 was warmest ever!!


The 30 yr normal is 1981-2010, thats should change. Its not house rules!

And HOLY CRAP.


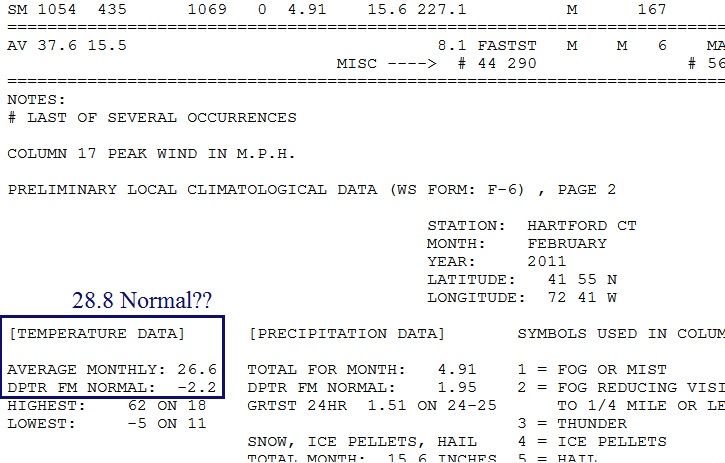
I just looked at February 2011, they are using 28.8. . Why are they lowering it?? Feb 2011 Instead of -2.2 below normal they show, it should be -4.1 degrees below normal. WOW!~!!

Last edited by Cambium; 04-03-2013 at 04:46 PM..
Reply With Quote Quick reply to this message
 
Old 04-03-2013, 04:49 PM
nei nei won $500 in our forum's Most Engaging Poster Contest - Thirteenth Edition (Jan-Feb 2015). 

Over $104,000 in prizes has already been given out to active posters on our forum and additional contests are planned
 
Location: Western Massachusetts
45,983 posts, read 53,485,386 times
Reputation: 15184
But the Western Regional Climate Center lists 29.7°F as the February 1981-2010 monthly average (click on the bar on the left):

HARTFORD WSO AIRPORT, CONNECTICUT - Climate Summary

where are you getting the 30.6°F from?
Reply With Quote Quick reply to this message
 
Old 04-03-2013, 05:02 PM
 
Location: Near the Coast SWCT
83,518 posts, read 75,307,397 times
Reputation: 16619
Quote:
Originally Posted by nei View Post
But the Western Regional Climate Center lists 29.7°F as the February 1981-2010 monthly average (click on the bar on the left):

HARTFORD WSO AIRPORT, CONNECTICUT - Climate Summary

where are you getting the 30.6°F from?
Thanks for replying nei.. That site isnt legit or should I say "official". In fact they even say it.. " Check NCDC normals table for official data"

NCDC is the official data.

Here's the link to BDL data which you can look at all the numbers and do the math. I got the 30.7 from there.

It's just too ironic ALL NWS Boston months for BDL match NCDC 1981-2010 normals EXCEPT February.

Local Climatological Data Publication - Select Month

Select "2012-ANNUAL" and click next. Then see the PDF file.
Reply With Quote Quick reply to this message
 
Old 04-03-2013, 05:29 PM
 
Location: Near the Coast SWCT
83,518 posts, read 75,307,397 times
Reputation: 16619
Here's a screenshot just in case anything "changes" with them.

Prior to 1983 they used the image PDF version. But anyone can add February 1981-2010 and divide by 30 and realize they are lieing. Man I hope this is just an error. But an error that hasnt been fixed since 2010.?


Reply With Quote Quick reply to this message
 
Old 04-03-2013, 07:00 PM
nei nei won $500 in our forum's Most Engaging Poster Contest - Thirteenth Edition (Jan-Feb 2015). 

Over $104,000 in prizes has already been given out to active posters on our forum and additional contests are planned
 
Location: Western Massachusetts
45,983 posts, read 53,485,386 times
Reputation: 15184
Quote:
Originally Posted by Cambium View Post
Thanks for replying nei.. That site isnt legit or should I say "official". In fact they even say it.. " Check NCDC normals table for official data"

NCDC is the official data.

Here's the link to BDL data which you can look at all the numbers and do the math. I got the 30.7 from there.

It's just too ironic ALL NWS Boston months for BDL match NCDC 1981-2010 normals EXCEPT February.

Local Climatological Data Publication - Select Month

Select "2012-ANNUAL" and click next. Then see the PDF file.
And it says a mean of 29.7°F. Check the row "normal dry bulb" on page 3.

The WRCC is directly from the weather station; take the average from 1981-2010 and you get 29.66°F.
Reply With Quote Quick reply to this message
 
Old 04-03-2013, 07:11 PM
 
Location: Near the Coast SWCT
83,518 posts, read 75,307,397 times
Reputation: 16619
Quote:
Originally Posted by nei View Post
And it says a mean of 29.7°F. Check the row "normal dry bulb" on page 3.

The WRCC is directly from the weather station; take the average from 1981-2010 and you get 29.66°F.
So explain why all the months take the mean temps from 1981 to 2010 divide by 30 and come up with all correct numbers except February.

Explain why they showing a false February mean?

These are the actual temps from NCDC for February 1981-2010. Explain this. I'm not making this up. Do the math. Same link as above..

Then after you do that... explain to me why in 2011 they show the February mean as 28.8??? Whats with that?

1981 35.3
1982 29.2
1983 29.1
1984 34.3
1985 29.9
1986 26.2
1987 26.7
1988 28.3
1989 28.6
1990 33
1991 33.9
1992 30.3
1993 54.3
1994 23.2
1995 25.8
1996 27.7
1997 34.7
1998 36.2
1999 31.8
2000 31
2001 28.4
2002 34.6
2003 23.7
2004 29.5
2005 30.1
2006 30
2007 23.9
2008 29.6
2009 30.4
2010 31


That month should have been -4.1 below normal.
Reply With Quote Quick reply to this message
 
Old 04-03-2013, 07:30 PM
nei nei won $500 in our forum's Most Engaging Poster Contest - Thirteenth Edition (Jan-Feb 2015). 

Over $104,000 in prizes has already been given out to active posters on our forum and additional contests are planned
 
Location: Western Massachusetts
45,983 posts, read 53,485,386 times
Reputation: 15184
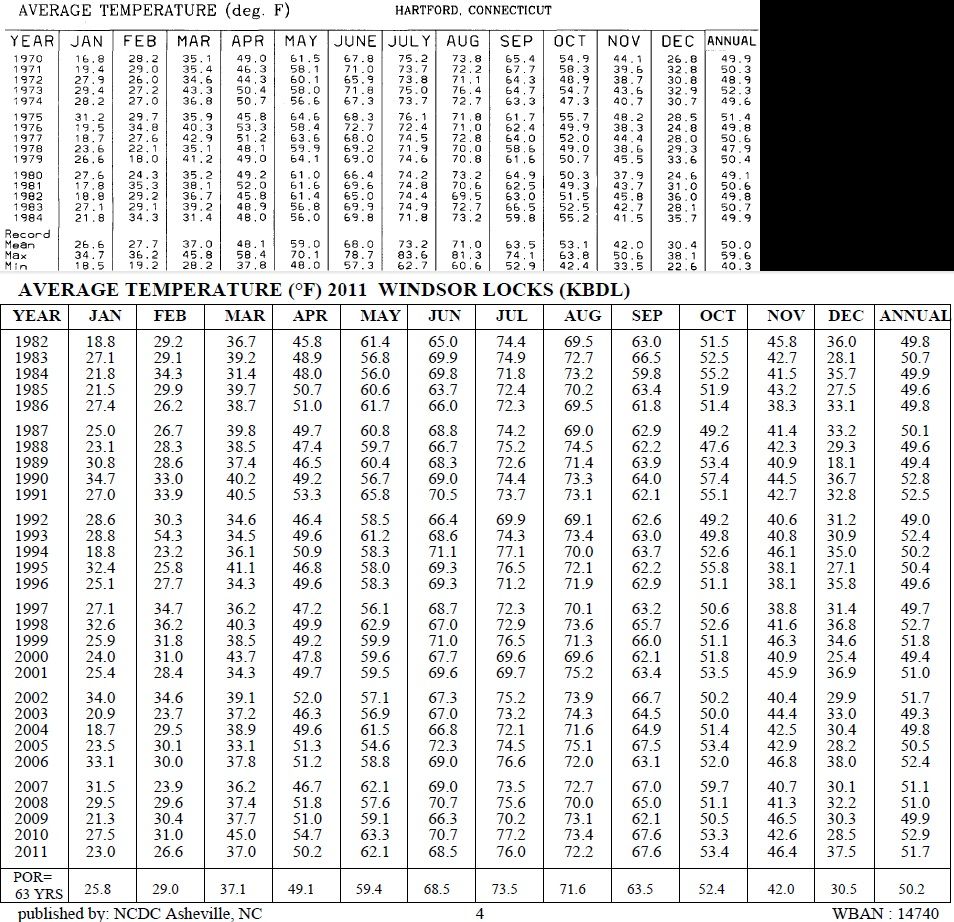
Stop. Did you check the WRCC link I keep posting. Those are the numbers used to calculate the 1981-2010 mean, the WRCC site which I keep linking to is where they come from. The WRCC site averages to 29.7°F if you do the math, the numbers come directly from the station. Average these:

Monthly Average Temperature, HARTFORD WSO AIRPORT, CONNECTICUT

They're not making up numbers. Your NCDC values are different from ones I'm posting in three ways:

1) The NCDC rounds to only one decimal place while the WRCC rounds to two.
2) A couple years are about 0.1°F different
3) 1993 in the NCDC record is 54.3°F. In the WRCC, 23.80°F.

(3) changes the normal 30 year mean by 1°F
Reply With Quote Quick reply to this message
 
Old 04-03-2013, 07:56 PM
 
Location: Near the Coast SWCT
83,518 posts, read 75,307,397 times
Reputation: 16619
BINGO!!! You may have found the error with NCDC!! I will contact them.

They have 54.3 for 1993!

But now... you didnt answer why The NWS used 28.8 as the normal for February 2011. Even if its 29.7 the depature is still wrong... Why are they dropping the normal?
Reply With Quote Quick reply to this message
 
Old 04-03-2013, 08:03 PM
nei nei won $500 in our forum's Most Engaging Poster Contest - Thirteenth Edition (Jan-Feb 2015). 

Over $104,000 in prizes has already been given out to active posters on our forum and additional contests are planned
 
Location: Western Massachusetts
45,983 posts, read 53,485,386 times
Reputation: 15184
Quote:
Originally Posted by Cambium View Post
But now... you didnt answer why The NWS used 28.8 as the normal for February 2011. Even if its 29.7 the depature is still wrong... Why are they dropping the normal?
Because they were still using the 1971-2000 normals. Check the WRCC for the normals:

HARTFORD WSO AIRPORT, CONNECTICUT NCDC 1971-2000 Monthly Normals
Reply With Quote Quick reply to this message
Please register to post and access all features of our very popular forum. It is free and quick. Over $68,000 in prizes has already been given out to active posters on our forum. Additional giveaways are planned.

Detailed information about all U.S. cities, counties, and zip codes on our site: City-data.com.


Reply
Please update this thread with any new information or opinions. This open thread is still read by thousands of people, so we encourage all additional points of view.

Quick Reply
Message:


Over $104,000 in prizes was already given out to active posters on our forum and additional giveaways are planned!

Go Back   City-Data Forum > General Forums > Weather
Similar Threads

All times are GMT -6. The time now is 01:27 PM.

© 2005-2024, Advameg, Inc. · Please obey Forum Rules · Terms of Use and Privacy Policy · Bug Bounty

City-Data.com - Contact Us - Archive 1, 2, 3, 4, 5, 6, 7, 8, 9, 10, 11, 12, 13, 14, 15, 16, 17, 18, 19, 20, 21, 22, 23, 24, 25, 26, 27, 28, 29, 30, 31, 32, 33, 34, 35, 36, 37 - Top