Please register to participate in our discussions with 2 million other members - it's free and quick! Some forums can only be seen by registered members. After you create your account, you'll be able to customize options and access all our 15,000 new posts/day with fewer ads.
I put "American" in case there's some big anomaly elsewhere in the world that I haven't heard of. The polar vortex was rather short-lived, and broke all-time records. As Chris Burt, of the Weather Underground said:
The only significant thing about the cold wave is how long it has been since a cold wave of this force has hit for some portions of the country--18 years, to be specific. Prior to 1996, cold waves of this intensity occurred pretty much every 5-10 years. In the 19th century, they occurred every year or two (since 1835). Something that, unlike the cold wave, is a truly unprecedented is the dry spell in California and Oregon, which is causing unprecedented winter wildfires in Northern California.
2013 was the driest year on record for most California. San Francisco recorded barely over 5" of rain, 40% less than the previous record. But that's a bit misleading, since rain is concentrated in the winter time. The end of 2012 was actually wetter than average. For Californian plants, which are adapted to store water for many months, it doesn't matter if the rain happened in November and December 2012 rather than January 2012 and 2013. It's all the same rainy season. A better way to measure is by rainy season. Last year's rainy season wasn't too out of whack. Here are the last few years for San Francisco:
Mean is around 23 inches. So somewhat of a deficit, with years back to back of below normal. But not really a drought. So far this season: 2.1 inches with almost half the rainy season over, lowest ever. Same is true for most of the northern two-thirds of the state. A strong ridge pattern has held its place throughout the winter and shows no signs of ending. Here's the high pressure anomaly:
which played a big role in setting a trough bringing cold air into the middle of the country. There's only a few months left, the grass hasn't regrown for the winter and the landscape is still brown. Mountains are barely covered with snow, I wonder if the warm spell at the moment might melt some of the snow still left?
Most coastal stations are at about 20% of normal. Unlikely that the rest of the winter season could make it up anywhere close. A drought isn't particularly exciting to watch, it's just day after day of mild and sunny weather, but it's still extreme. By the summer, the state will be a tinderbox (there have been fires, some small ones in the middle of winter even up in the usually very wet North Coast). Reservoir levels will be low. There are forecasts for an El Nino starting later in the spring. El Nino is associated with wetter weather in California, so perhaps that will be the end of the drought. Or at least, reorganize the atmosphere enough to dislodge the ridge. Once ridges start, they seem hard to stop.
Anyhow, put any new info on the drought and its consequences in this thread.
It's not just California but the entire west coast. According to your map, that ridge looks parked in the Pacific off the coast of BC and it shows. We've also had a much drier than normal winter. They didn't even have enough snow to open most of the ski runs on the north shore mountains here over Christmas which is unprecedented. I think it is better now that we got some rain last week but the long range forecast also looks very dry. If this keeps up, we will also be having water restrictions come the summer.
FOR THOSE HOPING FOR RAINFALL, UNFORTUNATELY NOTHING ENCOURAGING
TO REPORT EVEN LOOKING OUT THROUGH 16 DAYS (JANUARY 30TH) AS THE
EVER PERSISTENT RIDGE REBUILDS BEHIND THE DEPARTING LONGWAVE TROF.
500 MB HEIGHTS WILL ROCKET BACK UP T0 OVER 585 DM WITH 850 MB
TEMPS STILL WELL ABOVE NORMAL AND THE OFFSHORE FLOW CONTINUING AT
THE SURFACE. GOOD SHOT THAT WE WILL SEE MORE RECORD HIGHS SET NEXT
WEEK. EVEN LOOKING AT A SLEW OF ENSEMBLES AND MODELS REALLY DOES NOT
OFFER ANY SIGN OF HOPE. CONFIDENCE REMAINS VERY HIGH FOR THE MUCH
DRIER THAN NORMAL WEATHER TO CONTINUE THROUGH THE LAST FULL WEEK
OF THE MONTH.
UNLESS THERE IS A HUGE CHANGE IN THE PATTERN THAT THE MODELS ARE
NOT PICKING UP ON, WE ARE ON TRACK TO HAVE THE DRIEST JANUARY ON
RECORD FOR VIRTUALLY ALL LOCATIONS.
------------------------------------
NATIONAL WEATHER SERVICE SEATTLE WA
920 PM PST MON JAN 13 2014
.SHORT TERM... UPPER RIDGE BEGINS TO BUILD OVER THE AREA.
THE UPPER RIDGE WILL BE FIRMLY IN CONTROL WEDNESDAY AND THURSDAY.
LOW LEVEL OFFSHORE FLOW WILL DEVELOP WEDNESDAY...
.LONG TERM...AN UPPER RIDGE WILL BE OVER THE AREA ON FRIDAY FOR ONE
LAST DRY DAY. A WEAKENING FRONT WILL BRING A LITTLE RAIN SATURDAY
WITH SOME SHOWERS LINGERING INTO SUNDAY BEHIND THE FRONT. AN UPPER
RIDGE WILL REBUILD OVER THE AREA MONDAY FOR A RETURN TO DRY WEATHER
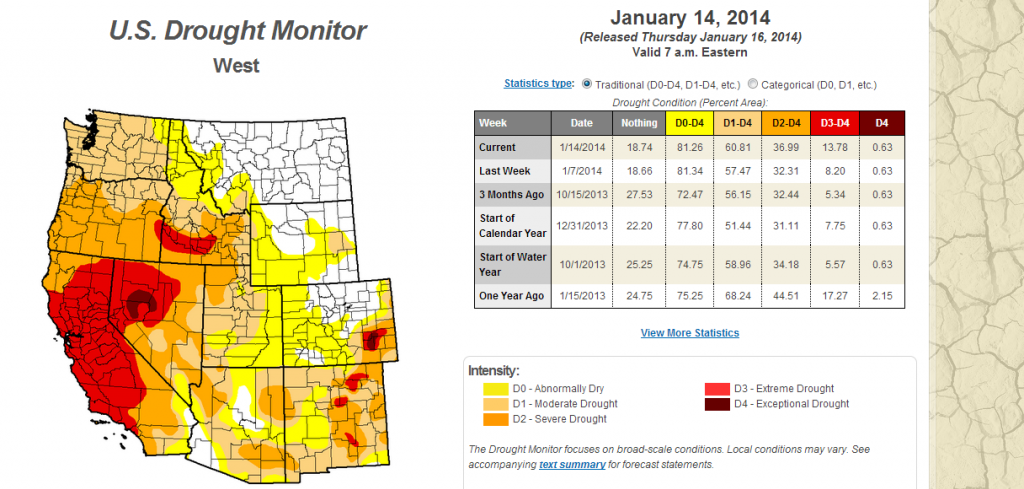
Here's the most recent update from the US Drought Monitor on the Western US drought:
Quote:
Despite the arrival of rain and high-elevation snow in the Northwest, drought persisted or intensified across the region. The most notable drought increases were from central California into the Pacific Northwest.
In northern portions of the region, a surge of Pacific moisture generated rain and mountain snow from the Cascades into the northern Rockies. Precipitation totals were highly variable, with 2- to 7-inch totals (liquid equivalent) in the northern Cascades contrasting with amounts generally less than 2 inches over southern portions of the range. Despite the moisture, the post-event statistics highlighted the intensifying drought in the region. The updated water-year precipitation totals stood at a meager 15 to 25 percent of normal in the Salmon Mountains of northwestern California, 25 to 55 percent in western Oregon, while northern portions of the Cascades (Washington) averaged 55 to 85 percent of normal precipitation for the water year. Snow Water Equivalent (SWE) in the Cascades of Oregon averaged 10 to 35 percent of normal, while the mountains of western Washington fared slightly better (30 to 60 percent of normal). Consequently, Severe Drought (D2) was expanded northward — despite the precipitation — to account for SWE rankings in the 15th percentile or lower (locally below the 5th percentile). SWE rankings in the eastern portions of Washington’s Cascades are likewise mostly in the 20th percentile or lower (locally in the lowest 5th percentile), reflecting the abnormally warm weather which has resulted in much of the precipitation falling as rain. Moderate Drought (D1) was also expanded across the Columbia River Valley in northern Oregon and central Washington due to increasing short-term dryness (water-year precipitation at 20 to 45 percent of normal) and declining soil moisture.
Farther south, a disappointing water year continued, with warm, dry weather firmly entrenched from central and southern California into the Great Basin. Most notably, Extreme Drought (D3) expanded across much of central and northern California into northwestern Nevada. Water-year precipitation in most of the D3 area was now less than 20 percent of normal, with locales from the southern San Joaquin Valley to the Pacific Coast reporting less than 10 percent of normal. Mountain snowpacks in the Sierra Nevada continued to dwindle as well, with SWE averaging between 10 and 30 percent of normal (10th percentile or lower, with many locations now in the bottom 5th percentile). Soil moisture across the northern two-thirds of California remained in very short supply, with similar moisture shortages noted in northwestern Nevada.
In the Four Corners region, changes to this week’s drought depiction were minimal. Minor increases were noted in D0 (Abnormal Dryness) across southwestern Colorado, while locally heavy precipitation (1 to 2 inches liquid equivalent, locally more) led to some D0 reduction in north-central Colorado. Otherwise the region remained mostly in a holding pattern with respect to drought intensification, with drought concerns most pronounced (water-year precipitation less than 50 percent of normal) from southeastern Arizona into central and eastern New Mexico.
I have to correct that statement. Wow! These were the cold records broken during that PV drop. 1700 records broken and some locations were coldest all time and coldest for month of January.
Indeed. It amazes me to see people downplay huge cold blasts by saying that it broke no records and similar weather happened before so it doesn't matter, yet these same people promote global warming hysteria when there's the biggest summer heat wave since the 1930's or 50's .
I'd say the huge cold wave in early January, which was, contrary to the downplaying seen in the media, some of the coldest air ever recorded across a wide swath of the country measured by afternoon temperatures, should be considered the biggest story if you think some monthly record highs in California is a huge story. Particularly when coupled with the rather big snow and ice storms that have hit the Eastern U.S., Chicago having the huge cold and the seventh-snowiest first half of the snowfall season on record*, and especially the massive ice storm a few weeks ago near the Canadian border which was followed by big snows before the massive cold wave came in. If that last one isn't a big story, I don't know what is.
At any rate, we're only one day past the halfway point of meteorological winter, so to talk about the biggest story of the winter at this point is simply premature. An instructive recent example is 2009-10, where the huge East Coast snowstorms were obviously the biggest story of the winter, and those didn't even start until early February with the exception of the mid-December storm. 2012-13 is another good example, with the bulk of the winter action and huge stories occurring in February and March. 1959-60 is possibly the most back-loaded winter of the 20th century, with memorable stories not even starting until March. Yet another example is 1992-93, whose biggest story (the Superstorm) didn't occur until the middle of March. So to repeat myself, I don't think we should even be talking about what the biggest story of the winter is until we know what happened in the second half of the winter.
In my opinion, the huge cold wave and the ongoing West Coast drought are tied for the biggest stories of the first half of the winter, with the number two spot being a tie between the borderland ice/snow storms and the massive Thanksgiving Texas snow/ice smackdown (remember that huge and virtually unprecedented cold/snow/ice event ? I know that it wasn't quite December, but that did inaugurate the winter pattern so it's close enough for me).
*It's funny how we hear almost nothing about the snow surplus, yet there was about 50 times as much media attention devoted to snow deficits of similar magnitude a few years back (and I'm talking about fifth-least snowy stuff, not the record streak stuff). Media bias of this nature has been well-documented by Cambium previously, and I find it disturbing just how short memories are of any sort of cold wave or snowstorm and how eager the media is to forget about it and not mention it, no matter how unprecedented or historic, contrasted by how similar intensities of warmth are constantly harped on by the media for months on end. Personally I think the anti-winter pro-heat-and-sun bias (particularly on TWC) and the global warming bias are feeding on each other and growing into a Frankenstein monster of media distortion.
I have to correct that statement. Wow! These were the cold records broken during that PV drop. 1700 records broken and some locations were coldest all time and coldest for month of January.
Most of those are daily records which just mean are previous cold wave didn't happen on those days in the record. As for the rest, I got the impression the cold spell wasn't any more sever than the 1994 and earlier ones. Seemed like the afternoon temps were more impressive than min temps in most places. But it's hard to find records as maxes don't show it, as it was warmer overnight. Whether the cold was record breaking probably should go in the polar vortex thread.
Quote:
It's not just California, I would put West Coast in the thread title.
California will get the biggest impact. It's just below average for the Pacific NW, record breaking for California. Some rainstorms have managed to hit the Pacific NW, but the ridge is always too strong to reach California. Look at the soil moisture percentiles:
The West Coast Drought started in October 2013. (September had above normal precip) Here's how the departure from normal precip looks last 3 months.
It may have, but September precipitation average nearly zero in California anyway, so besides exceptional cases whether September is above, or below average the total precipitation is so small as to make no difference on a drought
Please register to post and access all features of our very popular forum. It is free and quick. Over $68,000 in prizes has already been given out to active posters on our forum. Additional giveaways are planned.
Detailed information about all U.S. cities, counties, and zip codes on our site: City-data.com.

 Please register to participate in our discussions with 2 million other members - it's free and quick! Some forums can only be seen by registered members. After you create your account, you'll be able to customize options and access all our 15,000 new posts/day with fewer ads.


 .
. ? I know that it wasn't quite December, but that did inaugurate the winter pattern so it's close enough for me).


