Please register to participate in our discussions with 2 million other members - it's free and quick! Some forums can only be seen by registered members. After you create your account, you'll be able to customize options and access all our 15,000 new posts/day with fewer ads.
For Norway as a whole, the winter was 2.8C above normal (1961-90). This is the 16. warmest (since 1900). The absolute warmest high was 14.1C at Sunndalsøra, the absolute coldest was -42C in Karasjok.
February in Norway: For the country as a whole, February was 4.2C above the normal (61-90), among the 5 warmest (since 1900).
The warmest February mean was 5.1C (+2.4C) at Svinøy, second warmest was 4.8C (+2.3C) at Ona.
The coldest Feb mean was -9.2C at Karasjok (+6.3C) and Coavddathmohkki (286 m), both in Finnmark.
Warmest high was 14.1C at Sunndalsøra. The coldest low was -30.2C at Sihccajarvi (386 m).
The wettest station was Lurøy with 467 mm (237 %)
The driest was Nes with 4.7 mm (20 %).
The largest 24-hr precipitation was 147.5 mm at Hovlansdal.
Norwegian Arctic: Svalbard Airport recorded a mean of -13.9C (+2.3C). The mean at Jan Mayen was -4.9C (+1.2C).
Trondheim recorded a mean 4.4C above the old 1961-90 normal, making February the 23. consecutive month warmer than normal.
Ogimet - it's got a pretty big archive of weather data from all sorts of places around the world, just find the five-digit code for the site you want and put it in the URL in place of the 03344 in my link.
Who's laughing when all the baggage associated with drought comes home to stock? The propaganda never ends!
Also WA, CA, and AZ logged the warmest February by mean tmax; NY, VT, NH, and ME came in at the opposite end. The national tavg? Misleading!
Who's laughing when all the baggage associated with drought comes home to stock? The propaganda never ends!
Also WA, CA, and AZ logged the warmest February by mean tmax; NY, VT, NH, and ME came in at the opposite end. The national tavg? Misleading!
All I know is Farmers and home growers love, need and don't mind "warming temps".. its the cold that they need to fear, not the warming. Drought is different story, That's about Moisture and Pressures. But you can have a drought with cold/cool temps.
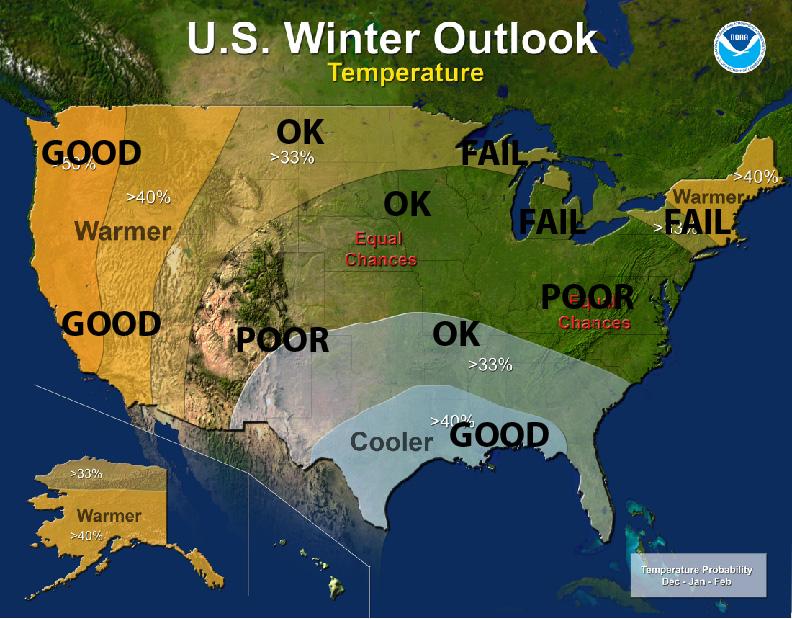
But will NOAA stop using the orange colors?? Even their forecasts are ................. nevermind
Those NOAA maps don't have the same scale, which is very irritating for comparison. 2012-2013 looks as warm as 2011-2012, even though they're not. At least zero is always white..
Those NOAA maps don't have the same scale, which is very irritating for comparison. 2012-2013 looks as warm as 2011-2012, even though they're not. At least zero is always white..
Yeah, scales are different to accommodate the larger anomalies. Here's the site its from
Please register to post and access all features of our very popular forum. It is free and quick. Over $68,000 in prizes has already been given out to active posters on our forum. Additional giveaways are planned.
Detailed information about all U.S. cities, counties, and zip codes on our site: City-data.com.

 Please register to participate in our discussions with 2 million other members - it's free and quick! Some forums can only be seen by registered members. After you create your account, you'll be able to customize options and access all our 15,000 new posts/day with fewer ads.