Please register to participate in our discussions with 2 million other members - it's free and quick! Some forums can only be seen by registered members. After you create your account, you'll be able to customize options and access all our 15,000 new posts/day with fewer ads.
Location: The western periphery of Terra Australis
24,544 posts, read 56,054,732 times
Reputation: 11862
Advertisements
I agree, the coldness of winter is not the only identifier of extra-tropicality. One possible measure, though, is a location where snow is rare in winter, but the average annual temperature is probably more important. I like using the 15C (60F) as a shibboleth of the temperate zone as it's the global average, and the globe is roughly divided by the torrid zone, warm zone and cooler zones. At sea-level the 15C isotherm tends to be centered around the high 30s latitude north and south.
I think subjectively 'sub-tropical' suggests a lack of a so-called 'true' winter, but I also like the idea of using the 10C (50F) line because I read the treeline roughly corresponds to the 10C summer isotherm.
Since it's a manmade concept, the whole idea of climate zones, we can argue about it endlessly. Just like the idea of race and colour the truth is every climate is unique from every other climate, so are more similar than others, but there's no magical dividing line between temperate and tropical just a transition zone.
I tend to like the 60 F (15 C) annual temp line as a dividing line as well. After reading and learning much on the weather blogs, as well as always pouring over ever-more climate data – I think 60 F (15 C) for an average annual mean tempis a really good line for “subtropical/Temperate climates”. That way, marginal areas that have too cool of winters (maybe Memphis, TN in the USA)….or too cool of summers (maybe San Francisco – USA) would be forced out of the subtropical classification zone. Also, you might be right, it does seem than the 15 C isotherm (annually) at sea-level seems to be in the mid to high 30's latitude wise (N/S). I don't know for sure, but I tend to doubt at sea-level one would find a station with a 15 C (or greater) annual mean temp north of around 35- 38 latitude N/S.
I really think if (when) Koppen/Trewartha climate classifications are reorginazed again by another academic…the 60 F/16 C mean annual temp should really be looked as the line between the Temperate (D) and Subtropical (C) zones.
From what I can tell... based on the 60F isotherm as the average annual temperature as the line that delineates temperate from subtropical, I think Redding, CA is the northern most subtropical climate in the US at 40N and Genoa, Italy the northernmost in the world at 44N.
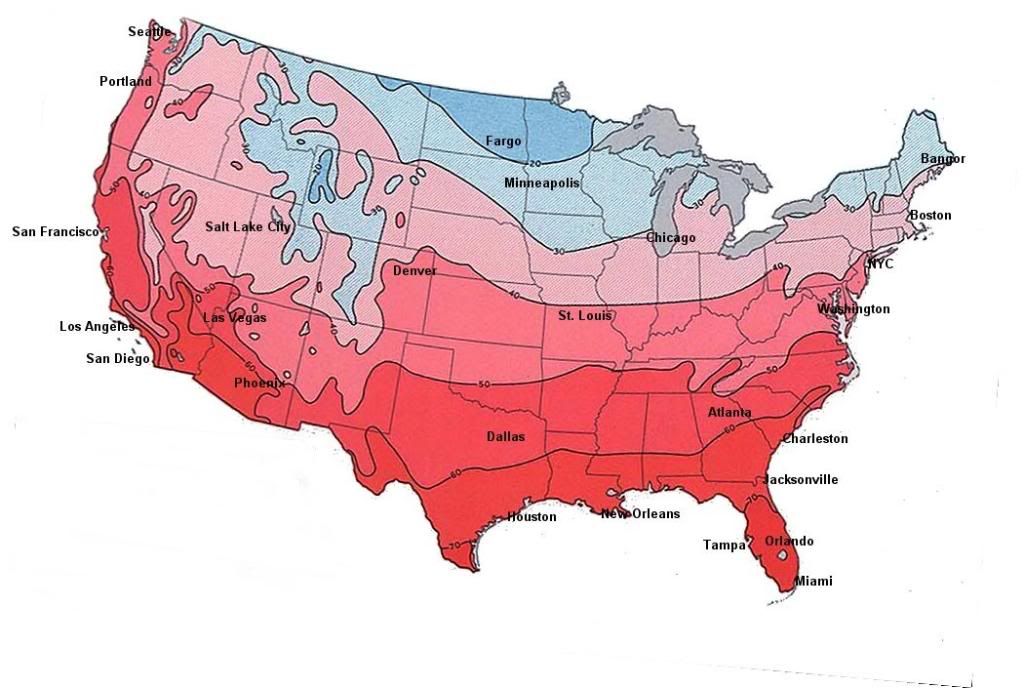
Wavehunter, once again, those maps are WAY off. It shows Macon, GA as an average high of 60F in January the average high there in January is around 55-56F. It's weird how in another thread you even acknowledged that those maps were off but you still post them up here
And it shows part of NC as having 60F january highs I don't even think Charleston, SC has an average high of 60F in January.
Those maps are way off. Mobile, Savannah, and most towns and cities in Miss and Ala do not have highs of 60 in January. BTW, Pittsburgh has avg Jan high in the 30's and Phila has an avg high of 39.5 in Jan, and we are the warmest part of our region. Charleston avg high is more like 57 in Jan, and you have to go to the extreme coast of Fl and Gulf Coast to get a high of 60 in Jan. But again, these avg highs are meaningless in the US. The real temps in winter will be all over the place, with highs of 40's one day and 60's the next. You have to go to extreme S. FL to get warm in winter, and even then it is hit or miss. The US climate is continental thru and thru in the east. Come visit in the winter then take a look at the avg's and see how they mean nothing.
Last edited by tom77falcons; 05-23-2011 at 02:26 AM..
Those maps are way off. Mobile, Savannah, and most towns and cities in Miss and Ala do not have highs of 60 in January. BTW, Pittsburgh has avg Jan high in the 30's and Phila has an avg high of 39.5 in Jan, and we are the warmest part of our region. Charleston avg high is more like 57 in Jan,
I’ve stated previously the NOAA monthly mean temps map has some margin of area (like all maps). Since maps are not numeric data – they will be off a few degrees +/-. However, you keep trying to find any location RIGHT ON THE LINE and say the maps are inaccurate. Of course, the ability of have a thermo line run 100% on a small resolution map is quite difficult...if not a little nit picking?
As to Mobile, Savannah, do not have highs of 60 in January...your are INCORRECT - according to their own NATIONAL WEATHER SERVICE sites:
The maps are still an EXCELLECT geographic large scale representation of monthly mean temps across the USA with a small margin of error. When YOU find a better source that covers a large geographic distance (10, 000 surface stations, 3, 537,928 Sq miles, 11, 357 cities/towns...etc)…let us know, I for one would love to see it.
I have issue with the 70 degree line in Florida. There are places in Central Florida (below the line) with average highs in the 60s during the winter. There's certainly other lines that could be quibbled over, but this one is most glaring.
I have issue with the 70 degree line in Florida. There are places in Central Florida (below the line) with average highs in the 60s during the winter. There's certainly other lines that could be quibbled over, but this one is most glaring.
Well since I always find climo maps interesting…lets’ examine that:
Let’s start with the coasts:
The 70 F (21 C) isotherm for the average daily high in January looks like it runs to about Daytona Beach (the hump that juts out into the Atlantic ocean is Cape Canaveral). So roughly it looks like all areas on the East Coast from Daytona Beach southward would have a average January high above 70 F….while all places north of Daytona Beach should have a high below 70 F. The 70 F LINE looks to run through metro Daytona Beach.
The 30 year average January high in Ocala, FL is 70. 5 F. So the +/- line appears to be less than + 0.5 F off.
So if you use the 70 F line, that appears to run in a Daytona Beach…Ocala….Inverness/Crystal River line…there seems to be little or no error at all. All three of these stations report a normal January high temp between 69 and 70. 5 F.
Since most maps have a 1 to 3 F margin of error (+/-)...I say that's a A performance from NOAA.
I’ve stated previously the NOAA monthly mean temps map has some margin of area (like all maps). Since maps are not numeric data – they will be off a few degrees +/-. However, you keep trying to find any location RIGHT ON THE LINE and say the maps are inaccurate. Of course, the ability of have a thermo line run 100% on a small resolution map is quite difficult...if not a little nit picking?
As to Mobile, Savannah, do not have highs of 60 in January...your are INCORRECT - according to their own NATIONAL WEATHER SERVICE sites:
The maps are still an EXCELLECT geographic large scale representation of monthly mean temps across the USA with a small margin of error. When YOU find a better source that covers a large geographic distance (10, 000 surface stations, 3, 537,928 Sq miles, 11, 357 cities/towns...etc)…let us know, I for one would love to see it.
Did you get these maps from the NOAA "Climate Atlas of the US"? You do know that data is old, and is based on the 1961 to 1990 averages. NOAA hasn't produced a climate atlas using 1981 to 2010 data, and hasn't even gotten around to producing an atlas using 1971 to 2000. Those maps are over 20 years old if you got them from the climate atlas. I'll bet those lines have all shifted southwards with the most recent data. They say there used to be orange groves all over northern FL even getting up to Jacksonville. Not now!
Did you get these maps from the NOAA "Climate Atlas of the US"? You do know that data is old, and is based on the 1961 to 1990 averages. NOAA hasn't produced a climate atlas using 1981 to 2010 data, and hasn't even gotten around to producing an atlas using 1971 to 2000. Those maps are over 20 years old if you got them from the climate atlas. I'll bet those lines have all shifted southwards with the most recent data. They say there used to be orange groves all over northern FL even getting up to Jacksonville. Not now!
The maps are based on 1970 – 2000 climate normals from NOAA. So the maps as well as the numeric data I linked from each NWS office – has NO data before 1970.
As far as lines shifting southwards…hmmm, I don't think so...lol:
You may or may not know, that the 1970’s was one of the coldest decades in American history, including the winter of 1976-1977…still the coldest winter in the United States since 1900. A wild guess...if the maps showed 1980 – 2010 normal’s/averages lines, those maps/tabular data would shift NORTH not south.
The 1990’s has been one of the warmest decades in the last 100 years in many areas of the USA. The NWS tabular data uses the 1970's....one of the coldest decades since 1900. When the 1980 -2010 maps/data are created, it seems very likely that they will be warmer. NYC for example, has more records for heat, high temps, heat waves, warmest summers, warmest winters…etc between 1980 and 2010.
Well since I always find climo maps interesting…lets’ examine that:
Let’s start with the coasts:
The 70 F (21 C) isotherm for the average daily high in January looks like it runs to about Daytona Beach (the hump that juts out into the Atlantic ocean is Cape Canaveral). So roughly it looks like all areas on the East Coast from Daytona Beach southward would have a average January high above 70 F….while all places north of Daytona Beach should have a high below 70 F. The 70 F LINE looks to run through metro Daytona Beach.
The 30 year average January high in Ocala, FL is 70. 5 F. So the +/- line appears to be less than + 0.5 F off.
So if you use the 70 F line, that appears to run in a Daytona Beach…Ocala….Inverness/Crystal River line…there seems to be little or no error at all. All three of these stations report a normal January high temp between 69 and 70. 5 F.
Since most maps have a 1 to 3 F margin of error (+/-)...I say that's a A performance from NOAA.
Ummm, it definitely goes a lot farther north than Ocala. It goes to about Gainesville/Lake City, both have average highs of about 64-66F in January.
The map also says that Nashville has an average high of 50F in January, which is incorrect. The average high is more like 44-45F.
It ALSO has STL, Cincy, and Pitt at over 40F, when all of these cities have average highs between 35-38F in January.
This map is way off, just admit it.
Please register to post and access all features of our very popular forum. It is free and quick. Over $68,000 in prizes has already been given out to active posters on our forum. Additional giveaways are planned.
Detailed information about all U.S. cities, counties, and zip codes on our site: City-data.com.

 Please register to participate in our discussions with 2 million other members - it's free and quick! Some forums can only be seen by registered members. After you create your account, you'll be able to customize options and access all our 15,000 new posts/day with fewer ads.


 the average high there in January is around 55-56F. It's weird how in another thread you even acknowledged that those maps were off but you still post them up here