Albany, OR (Oregon) Houses and Residents
| Albany: | $387,167 |
| Oregon: | $475,600 |
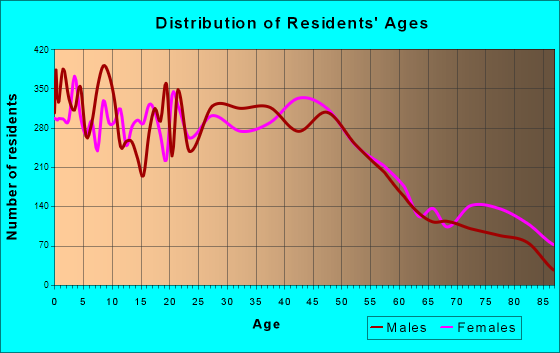
Total population: 51,980 (Urban population: 40,764 (all inside urban clusters), Rural population: 84 (all nonfarm))
Houses: 22,946 (22,050 occupied: 13,272 owner occupied, 8,780 renter occupied)
| % of renters here: | 40% |
| State: | 37% |
Housing density: 1,445 houses/condos per square mile
Median price asked for vacant for-sale houses and condos in 2022: $303,940.
Median contract rent in 2022: $1,049 (lower quartile is $812, upper quartile is $1,365)
Median rent asked for vacant for-rent units in 2022: $1,270
Median gross rent in Albany, OR in 2022: $1,167
Housing units in Albany with a mortgage: 9,234 (884 second mortgage, 14 home equity loan, 894 both second mortgage and home equity loan)
Houses without a mortgage: 170
Median household income for houses/condos with a mortgage: $106,475
Median household income for apartments without a mortgage: $60,230
Median monthly housing costs: $1,295
Compare current foreclosures in Albany, OR:
| Photo | Address | Area | Beds / Baths | Price | Details |
|---|---|---|---|---|---|

|
#1
Oak St SE
Albany, OR 97322
|
984 sq. feet
|
1 baths 3 beds |
show details | |

|
#2
Washington St SW
Albany, OR 97321
|
1,116 sq. feet
|
1 baths 2 beds |
show details | |

|
#3
Marten Ave SW
Albany, OR 97321
|
1,583 sq. feet
|
2 baths 3 beds |
show details | |

|
#4
16th Ave SW
Albany, OR 97321
|
983 sq. feet
|
1 baths 3 beds |
show details | |

|
#5
14th Ave SW
Albany, OR 97321
|
1,156 sq. feet
|
1 baths 2 beds |
show details | |

|
#6
NE Green Ct
Albany, OR 97321
|
1,638 sq. feet
|
1 baths 3 beds |
show details | |

|
#7
College Park Dr SW Unit 87
Albany, OR 97322
|
1,512 sq. feet
|
2 baths 4 beds |
show details | |

|
#8
Shady Oak Rd NE
Albany, OR 97322
|
2,693 sq. feet
|
2 baths 4 beds |
show details | |

|
#9
31st Ave SE
Albany, OR 97322
|
1,296 sq. feet
|
2 baths 3 beds |
show details | |

|
#10
Windsar Pl SE
Albany, OR 97322
|
1,045 sq. feet
|
1 baths 3 beds |
show details |
| Photo | Address | Area | Beds / Baths | Price | Details |
|---|---|---|---|---|---|

|
#11
NW Olivia Cir
Albany, OR 97321
|
2,525 sq. feet
|
3 baths 4 beds |
show details | |

|
#12
Calapooia St SW
Albany, OR 97321
|
1,970 sq. feet
|
1 baths 3 beds |
show details | |

|
#13
Cougar Ct SW
Albany, OR 97321
|
1,468 sq. feet
|
2 baths 3 beds |
show details | |

|
#14
7th Ave SW
Albany, OR 97321
|
1,626 sq. feet
|
1 baths 3 beds |
show details | |

|
#15
NW Bramblewood Ct
Albany, OR 97321
|
4,782 sq. feet
|
5 baths 4 beds |
show details | |

|
#16
Marion St SE
Albany, OR 97322
|
1,265 sq. feet
|
2 baths 3 beds |
show details | |

|
#17
Oak St SE
Albany, OR 97322
|
1,520 sq. feet
|
2 baths 4 beds |
show details | |

|
#18
Echo Springs Pl SE
Albany, OR 97322
|
1,484 sq. feet
|
1 baths 3 beds |
show details | |

|
#19
16th Ave SE
Albany, OR 97322
|
1,452 sq. feet
|
2 baths 3 beds |
show details | |

|
#20
NE Kindsey Ln
Albany, OR 97321
|
2,008 sq. feet
|
3 baths 4 beds |
show details |
| Photo | Address | Area | Beds / Baths | Price | Details |
|---|---|---|---|---|---|

|
#21
Adah Ave NE
Albany, OR 97322
|
960 sq. feet
|
1 baths 2 beds |
show details | |

|
#22
23rd Ave SE
Albany, OR 97322
|
1,008 sq. feet
|
1 baths 3 beds |
show details | |

|
#23
Montclair Dr NE
Albany, OR 97322
|
1,845 sq. feet
|
2 baths 3 beds |
show details | |

|
#24
23rd Ave SE
Albany, OR 97322
|
1,147 sq. feet
|
2 baths 3 beds |
show details | |

|
#25
Broadway St SW
Albany, OR 97321
|
1,201 sq. feet
|
2 baths 4 beds |
show details | |

|
#26
Eleanor Ave NE
Albany, OR 97322
|
705 sq. feet
|
1 baths 2 beds |
show details | |

|
#27
Columbus St SE Unit 108
Albany, OR 97322
|
1,188 sq. feet
|
2 baths 3 beds |
show details | |

|
#28
27th Ave SE
Albany, OR 97322
|
988 sq. feet
|
1 baths 3 beds |
show details | |

|
#29
Waverly Dr SE Unit 83
Albany, OR 97322
|
1,344 sq. feet
|
2 baths 2 beds |
show details | |

|
#30
2nd Ave SE
Albany, OR 97321
|
918 sq. feet
|
2 baths 3 beds |
show details |
| Photo | Address | Area | Beds / Baths | Price | Details |
|---|---|---|---|---|---|

|
#31
Millersburg Dr NE
Albany, OR 97321
|
2,768 sq. feet
|
2 baths 3 beds |
show details | |

|
#32
Jackson St SE
Albany, OR 97322
|
864 sq. feet
|
1 baths 2 beds |
show details | |

|
#33
Columbus St SE Unit 179
Albany, OR 97322
|
1,624 sq. feet
|
2 baths 3 beds |
show details | |

|
#34
Grenz Ln NE
Albany, OR 97322
|
2,184 sq. feet
|
2 baths 4 beds |
show details | |

|
#35
24th Ave SE
Albany, OR 97322
|
1,342 sq. feet
|
1 baths 3 beds |
show details | |

|
#36
Madison St SE
Albany, OR 97322
|
924 sq. feet
|
1 baths 3 beds |
show details | |

|
#37
18th Ave SE
Albany, OR 97322
|
912 sq. feet
|
1 baths 3 beds |
show details | |

|
#38
Burkhart St SE
Albany, OR 97321
|
1,192 sq. feet
|
1 baths 3 beds |
show details | |

|
#39
3rd Ave SE
Albany, OR 97321
|
1,040 sq. feet
|
1 baths 2 beds |
show details | |

|
#40
NW Quarry Rd
Albany, OR 97321
|
1,398 sq. feet
|
1 baths 3 beds |
show details |
| Photo | Address | Area | Beds / Baths | Price | Details |
|---|---|---|---|---|---|

|
#41
34th Ave SE
Albany, OR 97322
|
2,096 sq. feet
|
2 baths 5 beds |
show details | |

|
#42
9th Ave SW
Albany, OR 97321
|
864 sq. feet
|
1 baths 2 beds |
show details | |

|
#43
Madison St SE
Albany, OR 97322
|
1,288 sq. feet
|
2 baths 3 beds |
show details | |

|
#44
NW Oak Grove Dr
Albany, OR 97321
|
1,182 sq. feet
|
1 baths 4 beds |
show details | |

|
#45
Waverly Dr SE
Albany, OR 97322
|
1,024 sq. feet
|
1 baths 3 beds |
show details | |

|
#46
27th Ave SE
Albany, OR 97322
|
1,002 sq. feet
|
1 baths 2 beds |
show details | |

|
#47
18th Ave SE
Albany, OR 97322
|
1,686 sq. feet
|
2 baths 3 beds |
show details | |

|
#48
Cougar Ave SW
Albany, OR 97321
|
1,433 sq. feet
|
2 baths 3 beds |
show details | |

|
#49
Park Ter SW
Albany, OR 97321
|
801 sq. feet
|
1 baths 3 beds |
show details | |

|
Check over 1 million property listings on Foreclosure.com!
|
browse all offers | |||

Latest news about housing in Albany, OR collected exclusively by city-data.com from local newspapers, TV, and radio stations


Median year apartment built: 1980
Household type by relationship:
Households: 57,166- Male householders: 10,848 (2,199 living alone), Female householders: 10,947 (3,648 living alone)
10,728 spouses (10,598 opposite-sex spouses), 1,948 unmarried partners, (1,905 opposite-sex unmarried partners), 16,427 children (14,915 natural, 505 adopted, 1,006 stepchildren), 830 grandchildren, 559 brothers or sisters, 545 parents, 7 foster children, 492 other relatives, 2,821 non-relatives
- In group quarters: 1,009
Size of family households: 5,630 2-persons, 3,910 3-persons, 3,619 4-persons, 1,143 5-persons, 649 6-persons, 255 7-or-more-persons.
Size of nonfamily households: 5,022 1-person, 1,542 2-persons, 437 3-persons, 80 4-persons, 2 5-persons, 56 7-or-more-persons.
9,218 married couples with children.
3,703 single-parent households (1,188 men, 2,515 women).
88.9% of residents of Albany speak English at home.
8.9% of residents speak Spanish at home (60% speak English very well, 22% speak English well, 13% speak English not well, 6% don't speak English at all).
1.0% of residents speak other Indo-European language at home (58% speak English very well, 26% speak English well, 13% speak English not well, 3% don't speak English at all).
1.1% of residents speak Asian or Pacific Island language at home (58% speak English very well, 19% speak English well, 12% speak English not well, 11% don't speak English at all).
0.1% of residents speak other language at home (97% speak English very well, 3% don't speak English at all).
Foreign born population: 4,032 (7.1%)
(43.4% of them are naturalized citizens)
| Here: | 6.1 |
| State: | 6.2 |
| Here: | 3.9 |
| State: | 4.0 |

- Bedrooms in owner-occupied houses and condos in Albany, Oregon
- 138no bedroom
- 871 bedroom
- 1,7872 bedrooms
- 7,9503 bedrooms
- 2,5314 bedrooms
- 7795+ bedrooms

- Bedrooms in renter-occupied apartments in Albany, Oregon
- 502no bedroom
- 1,7841 bedroom
- 4,2702 bedrooms
- 1,9733 bedrooms
- 2224 bedrooms
- 305+ bedrooms

- Cars and other vehicles available in Albany in owner-occupied houses/condos
- 290no vehicle
- 3,1871 vehicle
- 5,2612 vehicles
- 2,7543 vehicles
- 1,3164 vehicles
- 4645+ vehicles

- Cars and other vehicles available in Albany in renter-occupied apartments
- 848no vehicle
- 3,6471 vehicle
- 3,3442 vehicles
- 7493 vehicles
- 1734 vehicles
- 185+ vehicles

- Rooms in owner-occupied houses in Albany, Oregon
- 1291 room
- 252 rooms
- 2283 rooms
- 1,4854 rooms
- 2,7965 rooms
- 3,2506 rooms
- 2,1947 rooms
- 1,3478 rooms
- 1,8199+ rooms

- Rooms in renter-occupied apartments in Albany, Oregon
- 4141 room
- 6192 rooms
- 1,4713 rooms
- 3,0234 rooms
- 1,7695 rooms
- 7026 rooms
- 3347 rooms
- 3068 rooms
- 1449+ rooms


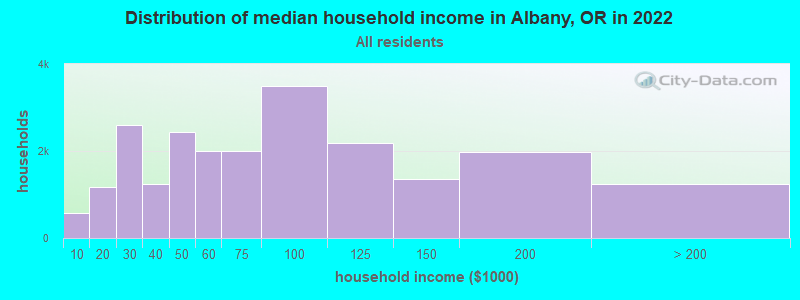
Albany, OR household income distribution

- 574Less than $10,000
- 1,161$10,000 to $19,999
- 2,603$20,000 to $29,999
- 1,246$30,000 to $39,999
- 2,433$40,000 to $49,999
- 1,994$50,000 to $59,999
- 2,008$60,000 to $74,999
- 3,504$75,000 to $99,999
- 2,179$100,000 to $124,999
- 1,357$125,000 to $149,999
- 1,975$150,000 to $199,999
- 1,236$200,000 or more
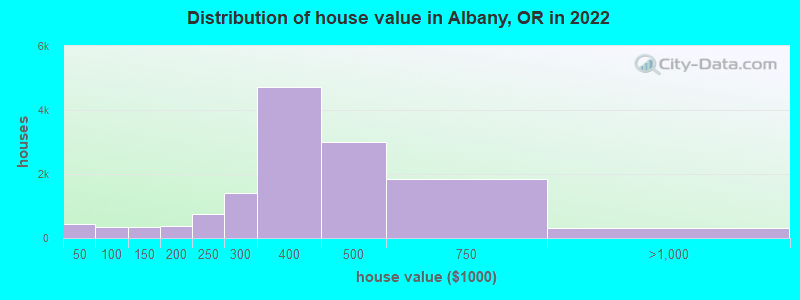
Home value of owner - occupied houses in 2022 in Albany, OR
-
- 101Less than $10,000
- 27$10,000 to $14,999
- 59$15,000 to $19,999
- 21$20,000 to $24,999
- 122$25,000 to $29,999
- 22$30,000 to $34,999
- 37$35,000 to $39,999
- 55$40,000 to $49,999
- 203$50,000 to $59,999
- 40$60,000 to $69,999
- 33$70,000 to $79,999
- 3$80,000 to $89,999
- 20$90,000 to $99,999
- 241$100,000 to $124,999
- 115$125,000 to $149,999
- 121$150,000 to $174,999
- 260$175,000 to $199,999
- 741$200,000 to $249,999
- 1,409$250,000 to $299,999
- 4,713$300,000 to $399,999
- 3,004$400,000 to $499,999
- 1,836$500,000 to $749,999
- 288$750,000 to $999,999
- 37$1,000,000 to $1,499,999
Rent paid by renters in 2022 in Albany, OR
-
- 52$100 to $149
- 53$150 to $199
- 43$200 to $249
- 88$250 to $299
- 56$300 to $349
- 22$350 to $399
- 7$400 to $449
- 166$450 to $499
- 77$500 to $549
- 79$550 to $599
- 96$600 to $649
- 103$650 to $699
- 493$700 to $749
- 412$750 to $799
- 805$800 to $899
- 963$900 to $999
- 1,883$1,000 to $1,249
- 1,195$1,250 to $1,499
- 1,035$1,500 to $1,999
- 353$2,000 to $2,499
- 11$2,500 to $2,999
- 17$3,000 to $3,499
- 15$3,500 or more
- 423No cash rent


Percentage of workers working in this county: 64.6%
Number of people working at home: 3,275 (12.6% of all workers)
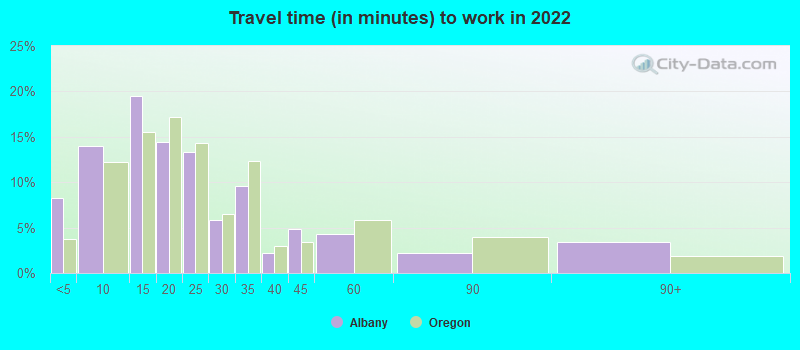
Travel time to work (commute)
- Less than 5 minutes: 1,292
- 5 to 9 minutes: 2,913
- 10 to 14 minutes: 4,200
- 15 to 19 minutes: 4,127
- 20 to 24 minutes: 3,242
- 25 to 29 minutes: 1,458
- 30 to 34 minutes: 2,370
- 35 to 39 minutes: 674
- 40 to 44 minutes: 741
- 45 to 59 minutes: 753
- 60 to 89 minutes: 599
- 90 or more minutes: 393
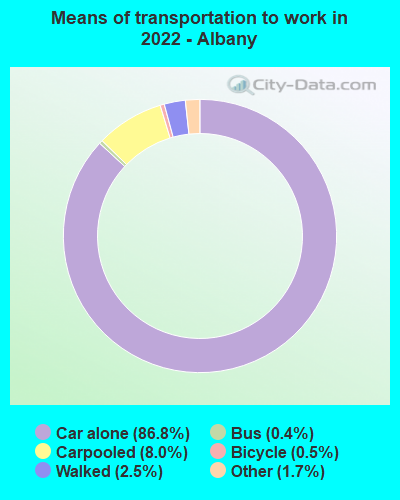
Means of transportation to work:
- Drove a car alone: 17,919 (74.6%)
- Carpooled: 1,682 (7.0%)
- Bus: 66 (0.3%)
- Light rail, streetcar or trolley: 7 (0.0%)
- Taxi: 405 (1.7%)
- Bicycle: 78 (0.3%)
- Walked: 580 (2.4%)
- Worked at home: 3,130 (13.0%)

- Unemployment by race in 2022
- Unemployment rate for White non-Hispanic residents
- 4.1%Males
- 7.2%Females
- Unemployment rate for American Indian and Alaska Native residents
- 2.6%Males
- Unemployment rate for Asian residents
- 8.1%Males
- Unemployment rate for other race residents
- 0.3%Males
- 5.7%Females
- Unemployment rate for two or more race residents
- 19.6%Males
- 5.7%Females
- Unemployment rate for Hispanic or Latino residents
- 7.4%Males
- 5.5%Females

- Year of entry for the foreign-born population in Albany, Oregon
- 8252010 or later
- 1,0072000 to 2009
- 7461990 to 1999
- 4951980 to 1989
- 1881970 to 1979
- 382Before 1970

First ancestries reported:
- German: 2,830 (11.8%)
- English: 2,468 (10.3%)
- American: 2,316 (9.7%)
- European: 1,902 (8.0%)
- Irish: 1,360 (5.7%)
- Norwegian: 608 (2.5%)
- African: 461 (1.9%)
- Scottish: 430 (1.8%)
- Greek: 372 (1.6%)
- Swedish: 302 (1.3%)
- Italian: 270 (1.1%)
- Dutch: 205 (0.9%)
- French: 149 (0.6%)
- Scandinavian: 147 (0.6%)
- Eastern European: 142 (0.6%)
- Northern European: 135 (0.6%)
- British: 120 (0.5%)
- Scotch-Irish: 117 (0.5%)
- Russian: 88 (0.4%)
- Swiss: 79 (0.3%)
- Danish: 79 (0.3%)
- French Canadian: 78 (0.3%)
- Finnish: 76 (0.3%)
- Portuguese: 72 (0.3%)
- Canadian: 61 (0.3%)
- Ukrainian: 53 (0.2%)
- Polish: 51 (0.2%)
- Czech: 46 (0.2%)
- Romanian: 41 (0.2%)
- Austrian: 38 (0.2%)
- Lebanese: 30 (0.1%)
- Nigerian: 29 (0.1%)
- Czechoslovakian: 27 (0.1%)
- Welsh: 15 (0.06%)
- Slavic: 13 (0.05%)
- Serbian: 11 (0.05%)
- Jamaican: 10 (0.04%)
- Yugoslavian: 8 (0.03%)
- Pennsylvania German: 7 (0.03%)
- Croatian: 7 (0.03%)
- Slovak: 6 (0.03%)
- Belgian: 5 (0.02%)
Most common places of birth for foreign-born residents (%):
| Albany: | 51.0% (1,686) |
| Oregon: | 33.9% (140,109) |
| Albany: | 6.1% (201) |
| Oregon: | 5.2% (21,429) |
| Albany: | 6.0% (199) |
| Oregon: | 3.5% (14,530) |
| Albany: | 5.0% (166) |
| Oregon: | 3.7% (15,229) |
| Albany: | 3.2% (105) |
| Oregon: | 2.1% (8,469) |
| Albany: | 2.1% (68) |
| Oregon: | 0.4% (1,765) |
| Albany: | 1.9% (62) |
| Oregon: | 1.0% (4,175) |
| Albany: | 1.7% (57) |
| Oregon: | 1.2% (5,082) |
| Albany: | 1.7% (57) |
| Oregon: | 1.5% (6,313) |
| Albany: | 1.6% (54) |
| Oregon: | 0.6% (2,667) |
Place of birth for U.S.-born residents:
- This state: 32,737
- Other state: 19,915
- Northeast: 1,782
- Midwest: 3,784
- South: 2,247
- West: 12,083
86.1% of Albany residents lived in the same house 1 years ago.
Out of people who lived in different houses, 33.2% lived in this county.
Out of people who lived in different counties, 70.0% lived in Oregon.
| Albany: | 86.1% |
| State average: | 85.5% |
Education attainment for males 25 years and older:
- No schooling: 86
- Nursery to 4th grade: 68
- 5th and 6th grade: 130
- 7th and 8th grade: 96
- 9th grade: 278
- 10th grade: 198
- 11th grade: 442
- 12th grade, no diploma: 232
- High school graduate (or equivalency): 5,233
- Less than 1 year of college: 2,182
- Some college more than 1 year, no degree: 2,826
- Associate degree: 1,888
- Bachelor's degree: 3,237
- Master's degree: 1,252
- Professional school degree: 139
- Doctorate degree: 352

Education attainment for females 25 years and older:
- No schooling: 201
- Nursery to 4th grade: 47
- 5th and 6th grade: 61
- 7th and 8th grade: 177
- 9th grade: 115
- 10th grade: 178
- 11th grade: 116
- 12th grade, no diploma: 123
- High school graduate (or equivalency): 5,371
- Less than 1 year of college: 2,211
- Some college more than 1 year, no degree: 3,001
- Associate degree: 2,319
- Bachelor's degree: 4,205
- Master's degree: 1,404
- Professional school degree: 228
- Doctorate degree: 234

Housing units in structures:
- One, detached: 14,099
- One, attached: 1,568
- Two: 969
- 3 or 4: 1,513
- 5 to 9: 1,019
- 10 to 19: 1,080
- 20 to 49: 642
- 50 or more: 641
- Mobile homes: 1,246
- Boats, RVs, vans, etc.: 165
Median worth of mobile homes: $134,866
Housing units lacking complete kitchen facilities in 2022: 1.9%
House/condo owner moved in on average 8 years ago
Renter moved in on average 3 years ago

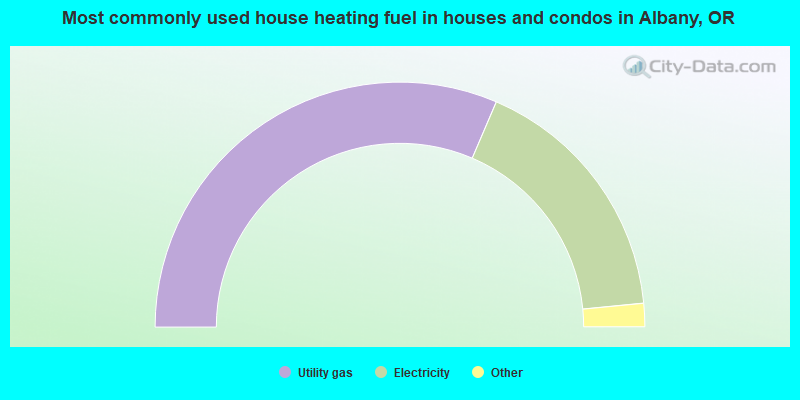
- 62.9%Utility gas
- 34.0%Electricity
- 1.5%Wood
- 1.0%Bottled, tank, or LP gas
- 0.4%Other fuel
- 0.2%No fuel used
- 0.1%Solar energy
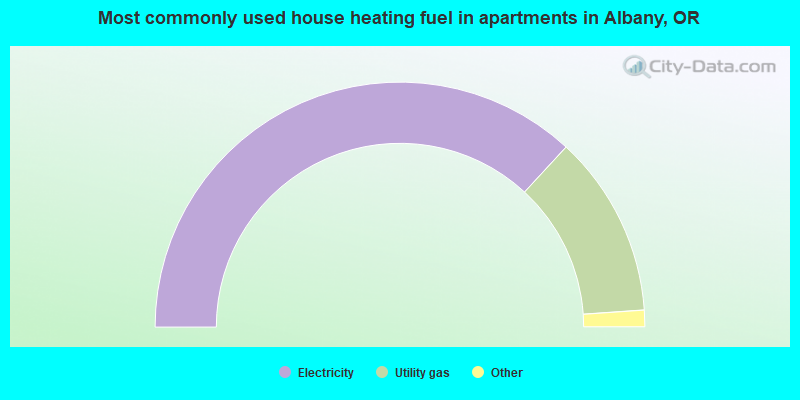
- 73.8%Electricity
- 24.1%Utility gas
- 1.1%Bottled, tank, or LP gas
- 0.8%No fuel used
- 0.3%Wood
Private vs. public school enrollment:
| Here: | 10.5% |
| Oregon: | 13.7% |
| Here: | 8.1% |
| Oregon: | 8.8% |
| Here: | 8.4% |
| Oregon: | 17.7% |


