Ashland, NJ (New Jersey) Houses and Residents
| Ashland: | $317,173 |
| New Jersey: | $428,900 |
Mean price in 2022:
Detached houses: $350,104
Here: $350,104 State: $537,591 Townhouses or other attached units: $277,553
Here: $277,553 State: $381,113 In 3-to-4-unit structures: $419,538
Here: $419,538 State: $457,463 In 5-or-more-unit structures: $239,420
Here: $239,420 State: $368,745
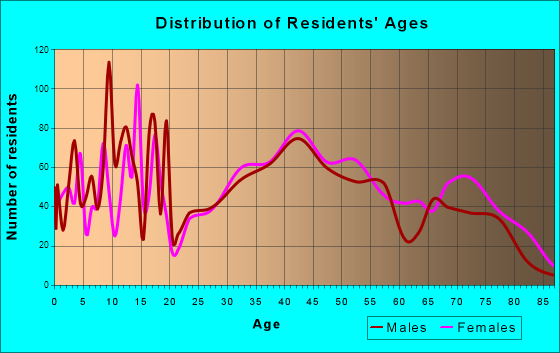
Total population: 8,302 (All urban)
Houses: 3,728 (3,642 occupied: 3,358 owner occupied, 348 renter occupied)
| % of renters here: | 9% |
| State: | 35% |
Housing density: 1,277 houses/condos per square mile
Median price asked for vacant for-sale houses and condos in 2022: $464,482.
Median contract rent in 2022: $1,813 (lower quartile is $1,136, upper quartile is over $2,000)
Median rent asked for vacant for-rent units in 2022: $2,161
Median gross rent in Ashland, NJ in 2022: over $2,000
Housing units in Ashland with a mortgage: 1,845 (131 second mortgage, 0 home equity loan, 131 both second mortgage and home equity loan)
Houses without a mortgage: 120
Median household income for houses/condos with a mortgage: $131,990
Median household income for apartments without a mortgage: $99,146
Median monthly housing costs: $1,655
Compare current foreclosures near Ashland, NJ:
| Photo | Address | Area | Beds / Baths | Price | Details |
|---|---|---|---|---|---|

|
#1
Covered Bridge Rd
Cherry Hill, NJ 08034
|
1,343 sq. feet
|
1 baths 3 beds |
$465,000
|
show details |

|
#2
Jessamine Ave
Oaklyn, NJ 08107
|
864 sq. feet
|
2 baths 5 beds |
$415,000
|
show details |

|
#3
Foxglove Dr
Riverside, NJ 08075
|
840 sq. feet
|
1 baths 2 beds |
$113,683
|
show details |

|
#4
Christian St
Philadelphia, PA 19146
|
1,612 sq. feet
|
2 baths 5 beds |
$474,050
|
show details |

|
#5
Maple Ave
Woodbury Heights, NJ 08097
|
1,390 sq. feet
|
2 baths 3 beds |
$279,900
|
show details |

|
#6
Edwards Ave
Barrington, NJ 08007
|
1,112 sq. feet
|
1 baths 3 beds |
$325,500
|
show details |

|
#7
Beechwood Rd
Clifton Heights, PA 19018
|
2,888 sq. feet
|
2 baths 4 beds |
$472,500
|
show details |

|
#8
Princeton Ave
Philadelphia, PA 19149
|
1,224 sq. feet
|
1 baths 3 beds |
$215,000
|
show details |

|
#9
Freeland Ave
Philadelphia, PA 19128
|
1,114 sq. feet
|
1 baths 3 beds |
$355,000
|
show details |

|
#10
Hawthorne Ct
Sewell, NJ 08080
|
1,110 sq. feet
|
2 baths 2 beds |
$189,900
|
show details |
| Photo | Address | Area | Beds / Baths | Price | Details |
|---|---|---|---|---|---|

|
#11
Broadway
Westville, NJ 08093
|
1,548 sq. feet
|
1 baths 3 beds |
$259,900
|
show details |

|
#12
Farragut Ct
Willingboro, NJ 08046
|
954 sq. feet
|
1 baths 2 beds |
$174,900
|
show details |

|
#13
N Front St Apt B
Philadelphia, PA 19123
|
2,491 sq. feet
|
2 baths 3 beds |
$677,500
|
show details |

|
#14
N 10th St
Philadelphia, PA 19141
|
1,154 sq. feet
|
2 baths 2 beds |
$78,000
|
show details |

|
#15
Manchester Rd
Elkins Park, PA 19027
|
3,444 sq. feet
|
2 baths 3 beds |
$570,000
|
show details |

|
#16
N 5th St
Philadelphia, PA 19126
|
1,420 sq. feet
|
2 baths 3 beds |
$313,900
|
show details |

|
#17
Edgewood Ave
Audubon, NJ 08106
|
1,250 sq. feet
|
1 baths 4 beds |
$389,900
|
show details |

|
#18
Benjamin Ct # 141
Philadelphia, PA 19114
|
1,553 sq. feet
|
3 baths 2 beds |
$251,000
|
show details |

|
#19
Harvey Ave
Pennsauken, NJ 08110
|
1,555 sq. feet
|
2 baths 4 beds |
$429,900
|
show details |

|
#20
N Forklanding Rd
Maple Shade, NJ 08052
|
1,450 sq. feet
|
1 baths 3 beds |
$259,900
|
show details |
| Photo | Address | Area | Beds / Baths | Price | Details |
|---|---|---|---|---|---|

|
#21
Kershaw St
Philadelphia, PA 19131
|
1,284 sq. feet
|
1 baths 3 beds |
$139,900
|
show details |

|
#22
Union St
Glassboro, NJ 08028
|
1,392 sq. feet
|
1 baths 3 beds |
$109,200
|
show details |

|
#23
N Philip St
Philadelphia, PA 19140
|
894 sq. feet
|
1 baths 3 beds |
$42,500
|
show details |

|
#24
Medford Rd
Philadelphia, PA 19154
|
1,360 sq. feet
|
1 baths 3 beds |
$161,441
|
show details |

|
#25
Redner St
Philadelphia, PA 19121
|
1,014 sq. feet
|
1 baths 3 beds |
$195,200
|
show details |

|
#26
67th Ave
Philadelphia, PA 19138
|
1,146 sq. feet
|
1 baths 3 beds |
$8,900
|
show details |
|
|
#27
N Sydenham St
Philadelphia, PA 19141
|
1,200 sq. feet
|
1 baths 3 beds |
$95,700
|
show details |

|
#28
E Fariston Dr
Philadelphia, PA 19120
|
1,152 sq. feet
|
1 baths 3 beds |
$140,260
|
show details |

|
#29
Church Rd
Philadelphia, PA 19131
|
1,280 sq. feet
|
1 baths 3 beds |
$201,955
|
show details |

|
#30
Cottage St
Philadelphia, PA 19135
|
1,536 sq. feet
|
1 baths 4 beds |
$82,339
|
show details |
| Photo | Address | Area | Beds / Baths | Price | Details |
|---|---|---|---|---|---|

|
#31
W Clapier St
Philadelphia, PA 19144
|
1,314 sq. feet
|
1 baths 3 beds |
$60,103
|
show details |

|
#32
Locust Ave
Bensalem, PA 19020
|
1,260 sq. feet
|
1 baths 3 beds |
$295,402
|
show details |

|
#33
N Myrtlewood St
Philadelphia, PA 19121
|
1,344 sq. feet
|
1 baths 3 beds |
$258,593
|
show details |

|
#34
E Godfrey Ave
Philadelphia, PA 19124
|
896 sq. feet
|
1 baths 3 beds |
$58,976
|
show details |

|
#35
W Duval St
Philadelphia, PA 19144
|
810 sq. feet
|
1 baths 3 beds |
$159,020
|
show details |

|
#36
Ella St
Philadelphia, PA 19120
|
1,024 sq. feet
|
1 baths 3 beds |
$101,535
|
show details |

|
#37
Scattergood St
Philadelphia, PA 19124
|
992 sq. feet
|
1 baths 3 beds |
$65,864
|
show details |

|
#38
F St
Philadelphia, PA 19124
|
1,160 sq. feet
|
1 baths 3 beds |
$51,444
|
show details |

|
#39
Hegerman St
Philadelphia, PA 19114
|
1,404 sq. feet
|
1 baths 3 beds |
$231,192
|
show details |

|
#40
Mercy St
Philadelphia, PA 19148
|
966 sq. feet
|
1 baths 3 beds |
$299,577
|
show details |
| Photo | Address | Area | Beds / Baths | Price | Details |
|---|---|---|---|---|---|

|
#41
Meridian St
Philadelphia, PA 19136
|
1,110 sq. feet
|
1 baths 3 beds |
$73,533
|
show details |

|
#42
Magnolia St
Philadelphia, PA 19144
|
1,200 sq. feet
|
1 baths 3 beds |
$20,792
|
show details |

|
#43
S 50th St
Philadelphia, PA 19143
|
1,510 sq. feet
|
1 baths 4 beds |
$210,087
|
show details |

|
#44
Atwood Rd
Philadelphia, PA 19151
|
1,256 sq. feet
|
1 baths 3 beds |
$32,040
|
show details |

|
#45
N 15th St
Philadelphia, PA 19141
|
1,280 sq. feet
|
1 baths 3 beds |
$71,287
|
show details |

|
#46
Stenton Ave
Philadelphia, PA 19138
|
1,256 sq. feet
|
1 baths 3 beds |
$214,722
|
show details |

|
#47
N 22nd St
Philadelphia, PA 19132
|
1,158 sq. feet
|
1 baths 3 beds |
$53,991
|
show details |

|
#48
Cobbs Creek Pkwy
Philadelphia, PA 19143
|
1,664 sq. feet
|
1 baths 4 beds |
$158,886
|
show details |

|
#49
E Cosgrove St
Philadelphia, PA 19144
|
1,178 sq. feet
|
1 baths 3 beds |
$93,332
|
show details |

|
Check over 1 million property listings on Foreclosure.com!
|
browse all offers | |||

Latest news about housing in Ashland, NJ collected exclusively by city-data.com from local newspapers, TV, and radio stations


Median year apartment built: 2009
Household type by relationship:
Households: 9,424- Male householders: 1,838 (196 living alone), Female householders: 1,797 (588 living alone)
2,387 spouses (2,370 opposite-sex spouses), 74 unmarried partners, (74 opposite-sex unmarried partners), 2,598 children (2,435 natural, 61 adopted, 101 stepchildren), 86 grandchildren, 38 brothers or sisters, 156 parents, 0 foster children, 143 other relatives, 102 non-relatives
- In group quarters: 200
Size of family households: 1,528 2-persons, 570 3-persons, 467 4-persons, 145 5-persons, 87 6-persons, 60 7-or-more-persons.
Size of nonfamily households: 795 1-person, 57 2-persons, 8 3-persons, 4 4-persons.
1,254 married couples with children.
316 single-parent households (21 men, 295 women).
85.0% of residents of Ashland speak English at home.
3.7% of residents speak Spanish at home (69% speak English very well, 30% speak English well, 1% don't speak English at all).
3.6% of residents speak other Indo-European language at home (78% speak English very well, 13% speak English well, 10% speak English not well).
6.2% of residents speak Asian or Pacific Island language at home (44% speak English very well, 33% speak English well, 19% speak English not well, 4% don't speak English at all).
0.5% of residents speak other language at home (64% speak English very well, 36% speak English well).
Foreign born population: 1,123 (11.9%)
(67.2% of them are naturalized citizens)
| Here: | 7.1 |
| State: | 6.8 |
| Here: | 5.3 |
| State: | 3.9 |

- Bedrooms in owner-occupied houses and condos in Ashland, New Jersey
- 0no bedroom
- 261 bedroom
- 8102 bedrooms
- 1,2803 bedrooms
- 8754 bedrooms
- 3695+ bedrooms

- Bedrooms in renter-occupied apartments in Ashland, New Jersey
- 11no bedroom
- 301 bedroom
- 1602 bedrooms
- 1433 bedrooms
- 44 bedrooms
- 05+ bedrooms

- Cars and other vehicles available in Ashland in owner-occupied houses/condos
- 19no vehicle
- 7841 vehicle
- 1,7112 vehicles
- 3723 vehicles
- 3534 vehicles
- 1195+ vehicles

- Cars and other vehicles available in Ashland in renter-occupied apartments
- 0no vehicle
- 1831 vehicle
- 1562 vehicles
- 93 vehicles
- 04 vehicles
- 05+ vehicles

- Rooms in owner-occupied houses in Ashland, New Jersey
- 01 room
- 02 rooms
- 313 rooms
- 2514 rooms
- 5035 rooms
- 6906 rooms
- 3727 rooms
- 6308 rooms
- 8839+ rooms

- Rooms in renter-occupied apartments in Ashland, New Jersey
- 111 room
- 02 rooms
- 263 rooms
- 554 rooms
- 945 rooms
- 906 rooms
- 247 rooms
- 198 rooms
- 299+ rooms


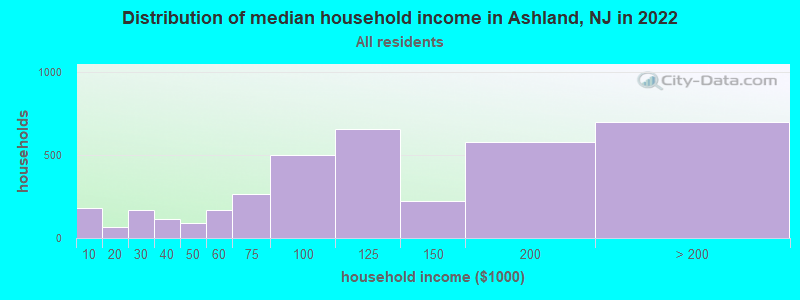
Ashland, NJ household income distribution

- 183Less than $10,000
- 69$10,000 to $19,999
- 171$20,000 to $29,999
- 117$30,000 to $39,999
- 88$40,000 to $49,999
- 168$50,000 to $59,999
- 266$60,000 to $74,999
- 498$75,000 to $99,999
- 655$100,000 to $124,999
- 223$125,000 to $149,999
- 576$150,000 to $199,999
- 699$200,000 or more
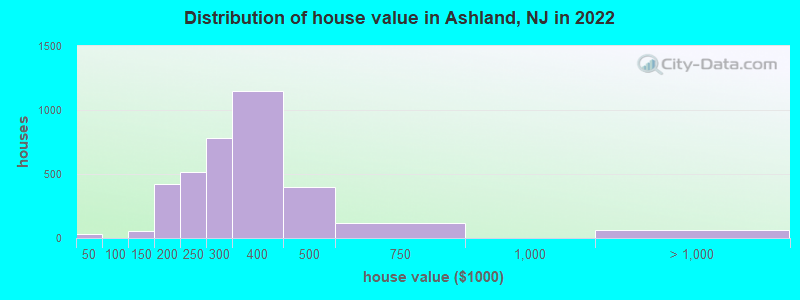
Home value of owner - occupied houses in 2022 in Ashland, NJ
-
- 10Less than $10,000
- 12$15,000 to $19,999
- 6$20,000 to $24,999
- 3$40,000 to $49,999
- 12$100,000 to $124,999
- 38$125,000 to $149,999
- 53$150,000 to $174,999
- 365$175,000 to $199,999
- 513$200,000 to $249,999
- 779$250,000 to $299,999
- 1,151$300,000 to $399,999
- 400$400,000 to $499,999
- 117$500,000 to $749,999
- 37$1,000,000 to $1,499,999
- 9$1,500,000 to $1,999,999
- 12$2,000,000 or more
Rent paid by renters in 2022 in Ashland, NJ
-
- 16$900 to $999
- 70$1,000 to $1,249
- 16$1,250 to $1,499
- 82$1,500 to $1,999
- 20$2,000 to $2,499
- 118$2,500 to $2,999
- 13$3,000 to $3,499
- 30No cash rent


Percentage of workers working in this county: 56.0%
Number of people working at home: 925 (18.2% of all workers)
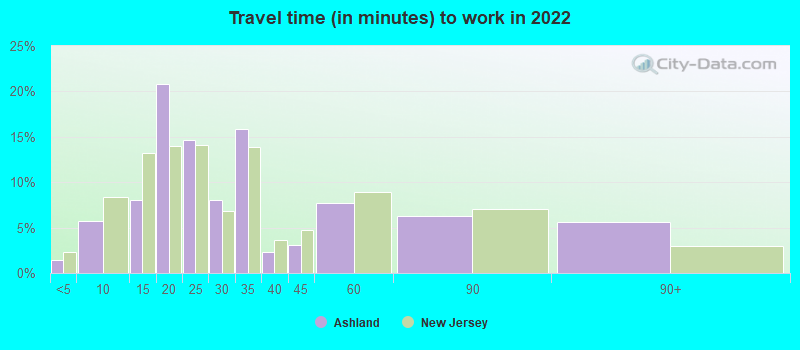
Travel time to work (commute)
- Less than 5 minutes: 105
- 5 to 9 minutes: 164
- 10 to 14 minutes: 460
- 15 to 19 minutes: 538
- 20 to 24 minutes: 945
- 25 to 29 minutes: 307
- 30 to 34 minutes: 468
- 35 to 39 minutes: 236
- 40 to 44 minutes: 313
- 45 to 59 minutes: 339
- 60 to 89 minutes: 154
- 90 or more minutes: 144
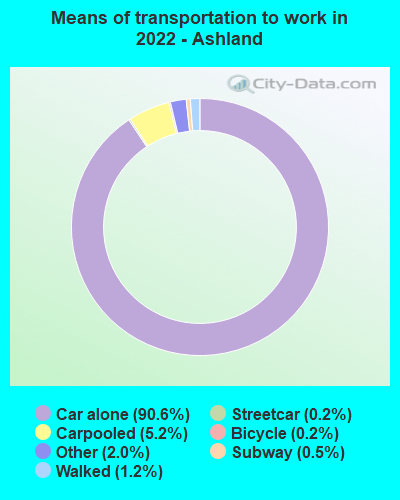
Means of transportation to work:
- Drove a car alone: 2,180 (64.5%)
- Carpooled: 166 (4.9%)
- Bus: 1 (0.0%)
- Subway or elevated rail: 4 (0.1%)
- Long-distance train or commuter rail: 9 (0.3%)
- Taxi: 72 (2.1%)
- Bicycle: 6 (0.2%)
- Walked: 39 (1.2%)
- Worked at home: 925 (27.4%)

- Unemployment by race in 2022
- Unemployment rate for White non-Hispanic residents
- 4.5%Males
- 2.7%Females
- Unemployment rate for Black residents
- 28.7%Males
- Unemployment rate for Asian residents
- 0.8%Males
- 15.5%Females
- Unemployment rate for Hispanic or Latino residents
- 4.7%Males
- 11.9%Females

- Year of entry for the foreign-born population in Ashland, New Jersey
- 1742010 or later
- 2652000 to 2009
- 3441990 to 1999
- 2821980 to 1989
- 1861970 to 1979
- 188Before 1970

First ancestries reported:
- Italian: 605 (15.1%)
- Irish: 402 (10.0%)
- American: 266 (6.6%)
- Russian: 197 (4.9%)
- Scandinavian: 197 (4.9%)
- German: 173 (4.3%)
- English: 125 (3.1%)
- Greek: 98 (2.4%)
- Polish: 81 (2.0%)
- Turkish: 64 (1.6%)
- British: 48 (1.2%)
- Ukrainian: 48 (1.2%)
- European: 39 (1.0%)
- Lithuanian: 32 (0.8%)
- Eastern European: 29 (0.7%)
- Jamaican: 27 (0.7%)
- Croatian: 23 (0.6%)
- Estonian: 19 (0.5%)
- Armenian: 12 (0.3%)
- Dutch: 12 (0.3%)
- Scotch-Irish: 12 (0.3%)
- Albanian: 10 (0.2%)
- Liberian: 10 (0.2%)
- Czechoslovakian: 9 (0.2%)
- Danish: 9 (0.2%)
- Scottish: 9 (0.2%)
- Swedish: 9 (0.2%)
- Northern European: 7 (0.2%)
- Israeli: 6 (0.1%)
Most common places of birth for foreign-born residents (%):
| Ashland: | 16.1% (177) |
| New Jersey: | 3.7% (78,969) |
| Ashland: | 11.8% (130) |
| New Jersey: | 0.7% (15,644) |
| Ashland: | 9.2% (101) |
| New Jersey: | 12.8% (274,609) |
| Ashland: | 7.1% (78) |
| New Jersey: | 4.0% (85,934) |
| Ashland: | 7.0% (77) |
| New Jersey: | 3.3% (70,512) |
| Ashland: | 5.3% (58) |
| New Jersey: | 2.2% (46,813) |
| Ashland: | 4.5% (49) |
| New Jersey: | 1.1% (22,760) |
| Ashland: | 3.8% (42) |
| New Jersey: | 4.8% (102,527) |
| Ashland: | 3.6% (40) |
| New Jersey: | 0.8% (16,778) |
| Ashland: | 3.5% (39) |
| New Jersey: | 9.7% (209,055) |
| Ashland: | 2.5% (28) |
| New Jersey: | 0.1% (1,662) |
| Ashland: | 2.4% (26) |
| New Jersey: | 0.3% (7,501) |
| Ashland: | 2.2% (24) |
| New Jersey: | 0.9% (18,317) |
| Ashland: | 2.2% (24) |
| New Jersey: | 0.5% (10,975) |
| Ashland: | 1.9% (21) |
| New Jersey: | 0.1% (2,316) |
| Ashland: | 1.7% (19) |
| New Jersey: | 0.3% (6,130) |
Place of birth for U.S.-born residents:
- This state: 4,526
- Other state: 3,685
- Northeast: 3,013
- Midwest: 367
- South: 285
- West: 52
94.8% of Ashland residents lived in the same house 1 years ago.
Out of people who lived in different houses, 33.0% lived in this county.
Out of people who lived in different counties, 46.9% lived in New Jersey.
| Ashland: | 94.8% |
| State average: | 90.4% |
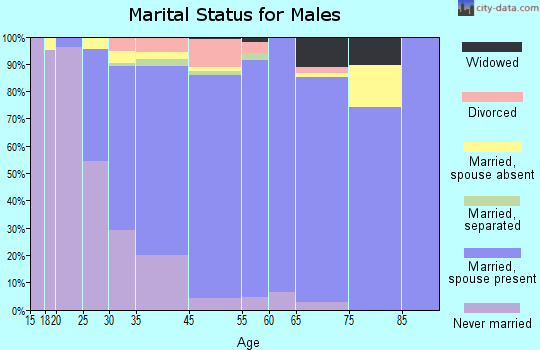
Education attainment for males 25 years and older:
- No schooling: 35
- Nursery to 4th grade: 0
- 5th and 6th grade: 7
- 7th and 8th grade: 0
- 9th grade: 0
- 10th grade: 5
- 11th grade: 26
- 12th grade, no diploma: 11
- High school graduate (or equivalency): 750
- Less than 1 year of college: 187
- Some college more than 1 year, no degree: 293
- Associate degree: 190
- Bachelor's degree: 877
- Master's degree: 587
- Professional school degree: 64
- Doctorate degree: 157

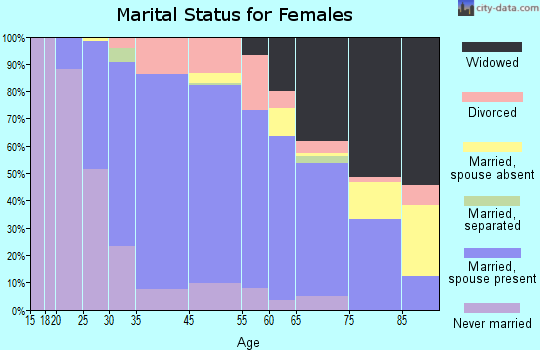
Education attainment for females 25 years and older:
- No schooling: 34
- Nursery to 4th grade: 0
- 5th and 6th grade: 42
- 7th and 8th grade: 3
- 9th grade: 18
- 10th grade: 10
- 11th grade: 17
- 12th grade, no diploma: 18
- High school graduate (or equivalency): 931
- Less than 1 year of college: 200
- Some college more than 1 year, no degree: 325
- Associate degree: 279
- Bachelor's degree: 1,395
- Master's degree: 624
- Professional school degree: 97
- Doctorate degree: 79

Housing units in structures:
- One, detached: 2,829
- One, attached: 371
- Two: 25
- 3 or 4: 122
- 5 to 9: 137
- 10 to 19: 48
- 20 to 49: 121
- 50 or more: 71
House/condo owner moved in on average 18 years ago
Renter moved in on average 1 years ago

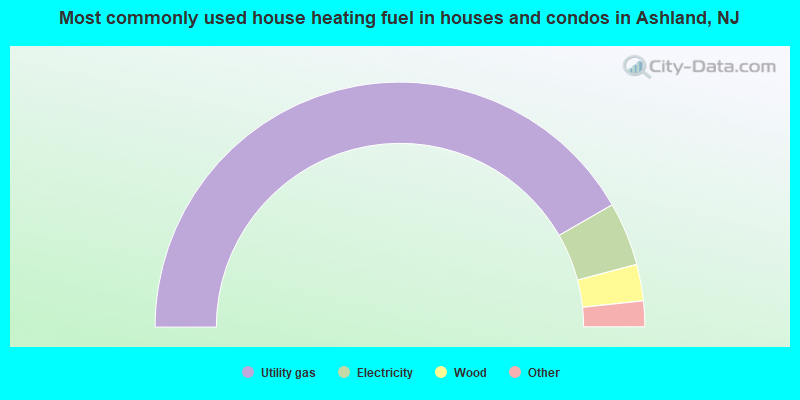
- 83.4%Utility gas
- 8.4%Electricity
- 4.8%Wood
- 2.4%Bottled, tank, or LP gas
- 0.9%Fuel oil, kerosene, etc.
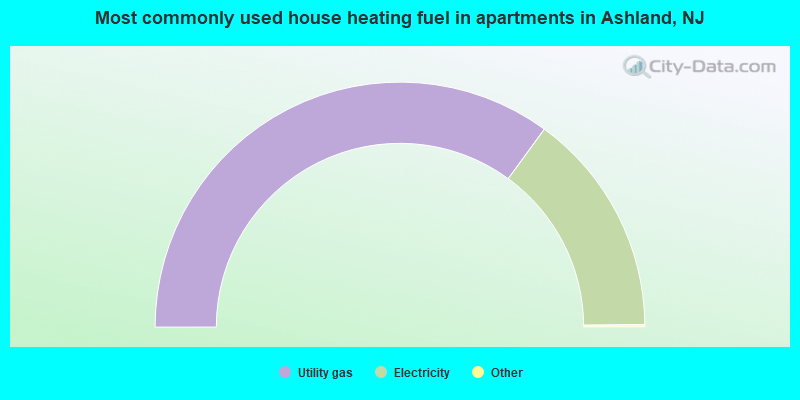
- 70.3%Utility gas
- 29.7%Electricity
Private vs. public school enrollment:
| Here: | 3.5% |
| New Jersey: | 12.3% |
| Here: | 6.4% |
| New Jersey: | 13.1% |
| Here: | 21.8% |
| New Jersey: | 33.2% |


