Auburn, WA (Washington) Houses and Residents
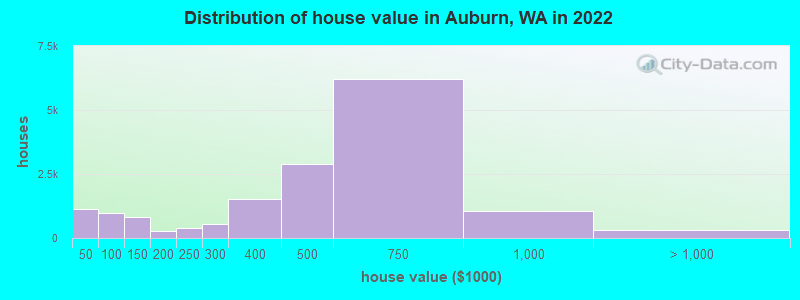
Estimated median house or condo value in 2022: $531,700 (it was $132,400 in 2000 )
Auburn:
$531,700Washington:
$569,500
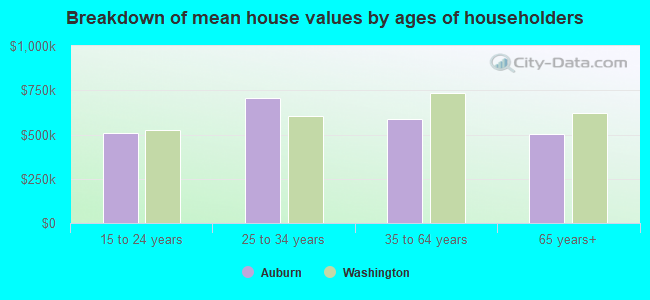
Lower value quartile - upper value quartile: $377,200 - $685,500Mean price in 2022: Detached houses: $567,688 Here:
$567,688State:
$734,307
Townhouses or other attached units: $415,287 Here:
$415,287State:
$657,697
In 3-to-4-unit structures: $390,084 Here:
$390,084State:
$510,239
In 5-or-more-unit structures: $301,718 Here:
$301,718State:
$503,183
Mobile homes: $121,140 Here:
$121,140State:
$218,362
Total population: 76,347 (Urban population: 40,044, Rural population: 235 (all nonfarm) )
Houses: 30,604 (29,356 occupied: 16,975 owner occupied, 12,381 renter occupied )
% of renters here:
42%State:
36%
Housing density: 1,439 houses/condos per square mile
Median price asked for vacant for-sale houses and condos in 2022: $429,725.
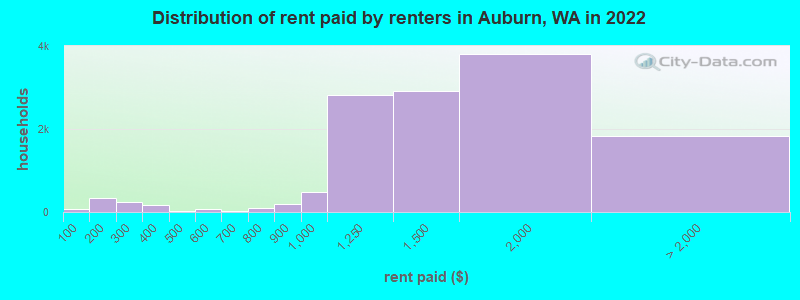
Median contract rent in 2022: $1,599 (lower quartile is $1,284, upper quartile is $1,919)
Median rent asked for vacant for-rent units in 2022: $1,697
Median gross rent in Auburn, WA in 2022: $1,718
Housing units in Auburn with a mortgage: 11,763 (1,531 second mortgage, 0 home equity loan, 1,413 both second mortgage and home equity loan )Houses without a mortgage: 90
Median household income for houses/condos with a mortgage: $121,989
Median household income for apartments without a mortgage: $108,402
Median monthly housing costs: $1,716
Data:
Median house or condo value ($)
Median house or condo value ($ change since 2000)
Median house or condo value ($) - White
Median house or condo value ($) - Black or African American
Median house or condo value ($) - Asian
Median house or condo value ($) - Hispanic or Latino
Median house or condo value ($) - American Indian and Alaska Native
Median house or condo value ($) - Multirace
Median house or condo value ($) - Other Race
Median price asked for mobile homes ($)
Household density (households per square mile)
Mean house or condo value by units in structure - 1, detached ($)
Mean house or condo value by units in structure - 1, attached ($)
Mean house or condo value by units in structure - 2 ($)
Mean house or condo value by units in structure by units in structure - 3 or 4 ($)
Mean house or condo value by units in structure - 5 or more ($)
Mean house or condo value by units in structure - Boat, RV, van, etc. ($)
Mean house or condo value by units in structure - Mobile home ($)
Median contract rent ($)
Median contract rent - Lower quartile ($)
Median contract rent - Upper quartile ($)
Median gross rent ($)
Urban houses (%)
Rural houses (%)
Houses occupied (%)
Houses occupied (% change since 2000)
Houses owner occupied (%)
Houses owner occupied (% change since 2000)
Houses renter occupied (%)
Houses renter occupied (% change since 2000)
Vacant housing units - For rent (%)
Vacant housing units - For rent (% change since 2000)
Vacant housing units - For sale only (%)
Vacant housing units - For sale only (% change since 2000)
Vacant housing units - Rented or sold, not occupied (%)
Vacant housing units - Rented or sold, not occupied (% change since 2000)
Vacant housing units - For seasonal, recreational, or occasional use (%)
Vacant housing units - For seasonal, recreational, or occasional use (% change since 2000)
Vacant housing units - For migrant workers (%)
Vacant housing units - For migrant workers (% change since 2000)
Vacant housing units - Other vacant (%)
Vacant housing units - Other vacant (% change since 2000)
Median monthly housing costs ($)
Median household income for houses/condos with a mortgage ($)
Median household income for houses/condos without a mortgage ($)
Median household income ($)
Median household income ($) - White
Median household income ($) - Black or African American
Median household income ($) - Asian
Median household income ($) - Hispanic or Latino
Median household income ($) - American Indian and Alaska Native
Median household income ($) - Multirace
Median household income ($) - Other Race
Mortgage status - with mortgage (%)
Mortgage status - with second mortgage (%)
Mortgage status - with home equity loan (%)
Mortgage status - with both second mortgage and home equity loan (%)
Mortgage status - without a mortgage (%)
Median year house/condo built
Median year apartment built
Household type by relationship - Male householder living alone (%)
Household type by relationship - Male householder not living alone (%)
Household type by relationship - Female householder living alone (%)
Household type by relationship - Female householder not living alone (%)
Household type by relationship - Opposite-Sex spouse (%)
Household type by relationship - Same-Sex spouse (%)
Household type by relationship - Opposite-Sex unmarried partner (%)
Household type by relationship - Same-Sex unmarried partner (%)
Household type by relationship - In group quarters (%)
Size of family households - 2-person household (%)
Size of family households - 3-person household (%)
Size of family households - 4-person household (%)
Size of family households - 5-person household (%)
Size of family households - 6-person household (%)
Size of family households - 7-or-more-person household (%)
Size of nonfamily households - 1-person household (%)
Size of nonfamily households - 2-person household (%)
Size of nonfamily households - 3-person household (%)
Size of nonfamily households - 4-person household (%)
Size of nonfamily households - 5-person household (%)
Size of nonfamily households - 6-person household (%)
Size of nonfamily households - 7-or-moreperson household (%)
Year house built - Built 2010 or later (%)
Year house built - Built 2000 to 2009 (%)
Year house built - Built 1990 to 1999 (%)
Year house built - Built 1980 to 1989 (%)
Year house built - Built 1970 to 1979 (%)
Year house built - Built 1960 to 1969 (%)
Year house built - Built 1950 to 1959 (%)
Year house built - Built 1940 to 1949 (%)
Year house built - Built 1939 or earlier (%)
Median number of rooms in houses and condos
Median number of rooms in apartments
Median number of bedrooms in owner occupied houses
Mean number of bedrooms in owner occupied houses
Median number of bedrooms in renter occupied houses
Mean number of bedrooms in renter occupied houses
Median number of vehichles in owner occupied houses
Mean number of vehichles in owner occupied houses
Median number of vehichles in renter occupied houses
Mean number of vehichles in renter occupied houses
Rooms in owner-occupied houses - 1 room (%)
Rooms in owner-occupied houses - 2 rooms (%)
Rooms in owner-occupied houses - 3 rooms (%)
Rooms in owner-occupied houses - 4 rooms (%)
Rooms in owner-occupied houses - 5 rooms (%)
Rooms in owner-occupied houses - 6 rooms (%)
Rooms in owner-occupied houses - 7 rooms (%)
Rooms in owner-occupied houses - 8 rooms (%)
Rooms in owner-occupied houses - 9+ rooms (%)
Rooms in renter-occupied houses - 1 room (%)
Rooms in renter-occupied houses - 2 rooms (%)
Rooms in renter-occupied houses - 3 rooms (%)
Rooms in renter-occupied houses - 4 rooms (%)
Rooms in renter-occupied houses - 5 rooms (%)
Rooms in renter-occupied houses - 6 rooms (%)
Rooms in renter-occupied houses - 7 rooms (%)
Rooms in renter-occupied houses - 8 rooms (%)
Rooms in renter-occupied houses - 9+ rooms (%)
Bedrooms in owner-occupied houses - no bedrooms (%)
Bedrooms in owner-occupied houses - 1 bedroom (%)
Bedrooms in owner-occupied houses - 2 bedrooms (%)
Bedrooms in owner-occupied houses - 3 bedrooms (%)
Bedrooms in owner-occupied houses - 4 bedrooms (%)
Bedrooms in owner-occupied houses - 5+ bedrooms (%)
Bedrooms in renter-occupied houses - no bedrooms (%)
Bedrooms in renter-occupied houses - 1 bedroom (%)
Bedrooms in renter-occupied houses - 2 bedrooms (%)
Bedrooms in renter-occupied houses - 3 bedrooms (%)
Bedrooms in renter-occupied houses - 4 bedrooms (%)
Bedrooms in renter-occupied houses - 5+ bedrooms (%)
Vehicles available in owner-occupied houses - no vehicle available (%)
Vehicles available in owner-occupied houses - 1 vehicle available(%)
Vehicles available in owner-occupied houses - 2 Vehicles available (%)
Vehicles available in owner-occupied houses - 3 Vehicles available (%)
Vehicles available in owner-occupied houses - 4 Vehicles available (%)
Vehicles available in owner-occupied houses - 5+ Vehicles available (%)
Vehicles available in renter-occupied houses - no vehicle available (%)
Vehicles available in renter-occupied houses - 1 vehicle available (%)
Vehicles available in renter-occupied houses - 2 Vehicles available (%)
Vehicles available in renter-occupied houses - 3 Vehicles available (%)
Vehicles available in renter-occupied houses - 4 Vehicles available (%)
Vehicles available in renter-occupied houses - 5+ Vehicles available (%)
Housing units in structures - 1, detached (%)
Housing units in structures - 1, attached (%)
Housing units in structures - 2 (%)
Housing units in structures - 3 or 4 (%)
Housing units in structures - 5 to 9 (%)
Housing units in structures - 10 to 19 (%)
Housing units in structures - 20 to 49 (%)
Housing units in structures - 50 or more (%)
Housing units in structures - Mobile home (%)
Housing units in structures - Boat, RV, van, etc. (%)
Housing units in structures - Owners - 1, detached (%)
Housing units in structures - Owners - 1, attached (%)
Housing units in structures - Owners - 2 (%)
Housing units in structures - Owners - 3 or 4 (%)
Housing units in structures - Owners - 5 to 9 (%)
Housing units in structures - Owners - 10 to 19 (%)
Housing units in structures - Owners - 20 to 49 (%)
Housing units in structures - Owners - 50 or more (%)
Housing units in structures - Owners - Mobile home (%)
Housing units in structures - Owners - Boat, RV, van, etc. (%)
Housing units in structures - Renters - 1, detached (%)
Housing units in structures - Renters - 1, attached (%)
Housing units in structures - Renters - 2 (%)
Housing units in structures - Renters - 3 or 4 (%)
Housing units in structures - Renters - 5 to 9 (%)
Housing units in structures - Renters - 10 to 19 (%)
Housing units in structures - Renters - 20 to 49 (%)
Housing units in structures - Renters - 50 or more (%)
Housing units in structures - Renters - Mobile home (%)
Housing units in structures - Renters - Boat, RV, van, etc. (%)
House/condo owner moved in on average (years ago)
Renter moved in on average (years ago)
Year householder moved into unit - Moved in 1999 to March 2000 (%)
Year householder moved into unit - Moved in 1999 to March 2000 (%) - White
Year householder moved into unit - Moved in 1999 to March 2000 (%) - Black or African American
Year householder moved into unit - Moved in 1999 to March 2000 (%) - Asian
Year householder moved into unit - Moved in 1999 to March 2000 (%) - Hispanic or Latino
Year householder moved into unit - Moved in 1999 to March 2000 (%) - American Indian and Alaska Native
Year householder moved into unit - Moved in 1999 to March 2000 (%) - Multirace
Year householder moved into unit - Moved in 1999 to March 2000 (%) - Other Race
Year householder moved into unit - Moved in 1995 to 1998 (%)
Year householder moved into unit - Moved in 1995 to 1998 (%) - White
Year householder moved into unit - Moved in 1995 to 1998 (%) - Black or African American
Year householder moved into unit - Moved in 1995 to 1998 (%) - Asian
Year householder moved into unit - Moved in 1995 to 1998 (%) - Hispanic or Latino
Year householder moved into unit - Moved in 1995 to 1998 (%) - American Indian and Alaska Native
Year householder moved into unit - Moved in 1995 to 1998 (%) - Multirace
Year householder moved into unit - Moved in 1995 to 1998 (%) - Other Race
Year householder moved into unit - Moved in 1990 to 1994 (%)
Year householder moved into unit - Moved in 1990 to 1994 (%) - White
Year householder moved into unit - Moved in 1990 to 1994 (%) - Black or African American
Year householder moved into unit - Moved in 1990 to 1994 (%) - Asian
Year householder moved into unit - Moved in 1990 to 1994 (%) - Hispanic or Latino
Year householder moved into unit - Moved in 1990 to 1994 (%) - American Indian and Alaska Native
Year householder moved into unit - Moved in 1990 to 1994 (%) - Multirace
Year householder moved into unit - Moved in 1990 to 1994 (%) - Other Race
Year householder moved into unit - Moved in 1980 to 1989 (%)
Year householder moved into unit - Moved in 1980 to 1989 (%) - White
Year householder moved into unit - Moved in 1980 to 1989 (%) - Black or African American
Year householder moved into unit - Moved in 1980 to 1989 (%) - Asian
Year householder moved into unit - Moved in 1980 to 1989 (%) - Hispanic or Latino
Year householder moved into unit - Moved in 1980 to 1989 (%) - American Indian and Alaska Native
Year householder moved into unit - Moved in 1980 to 1989 (%) - Multirace
Year householder moved into unit - Moved in 1980 to 1989 (%) - Other Race
Year householder moved into unit - Moved in 1970 to 1979 (%)
Year householder moved into unit - Moved in 1970 to 1979 (%) - White
Year householder moved into unit - Moved in 1970 to 1979 (%) - Black or African American
Year householder moved into unit - Moved in 1970 to 1979 (%) - Asian
Year householder moved into unit - Moved in 1970 to 1979 (%) - Hispanic or Latino
Year householder moved into unit - Moved in 1970 to 1979 (%) - American Indian and Alaska Native
Year householder moved into unit - Moved in 1970 to 1979 (%) - Multirace
Year householder moved into unit - Moved in 1970 to 1979 (%) - Other Race
Year householder moved into unit - Moved in 1969 or earlier (%)
Year householder moved into unit - Moved in 1969 or earlier (%) - White
Year householder moved into unit - Moved in 1969 or earlier (%) - Black or African American
Year householder moved into unit - Moved in 1969 or earlier (%) - Asian
Year householder moved into unit - Moved in 1969 or earlier (%) - Hispanic or Latino
Year householder moved into unit - Moved in 1969 or earlier (%) - American Indian and Alaska Native
Year householder moved into unit - Moved in 1969 or earlier (%) - Multirace
Year householder moved into unit - Moved in 1969 or earlier (%) - Other Race
Housing units lacking complete plumbing facilities (%)
Housing units lacking complete kitchen facilities (%)
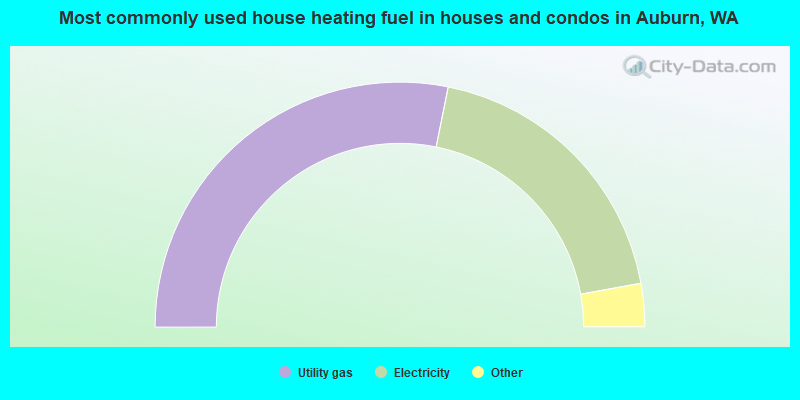
House heating fuel used in houses and condos - Utility gas (%)
House heating fuel used in houses and condos - Bottled, tank, or LP gas (%)
House heating fuel used in houses and condos - Electricity (%)
House heating fuel used in houses and condos - Fuel oil, kerosene, etc. (%)
House heating fuel used in houses and condos - Coal or coke (%)
House heating fuel used in houses and condos - Wood (%)
House heating fuel used in houses and condos - Solar energy (%)
House heating fuel used in houses and condos - Other fuel (%)
House heating fuel used in houses and condos - No fuel used (%)
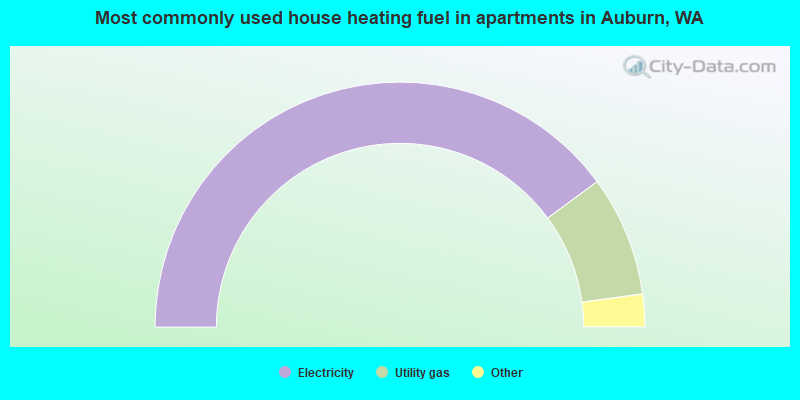
House heating fuel used in apartments - Utility gas (%)
House heating fuel used in apartments - Bottled, tank, or LP gas (%)
House heating fuel used in apartments - Electricity (%)
House heating fuel used in apartments - Fuel oil, kerosene, etc. (%)
House heating fuel used in apartments - Coal or coke (%)
House heating fuel used in apartments - Wood (%)
House heating fuel used in apartments - Solar energy (%)
House heating fuel used in apartments - Other fuel (%)
House heating fuel used in apartments - No fuel used (%)
Latest news about housing in Auburn, WA collected exclusively by city-data.com from local newspapers, TV, and radio stations
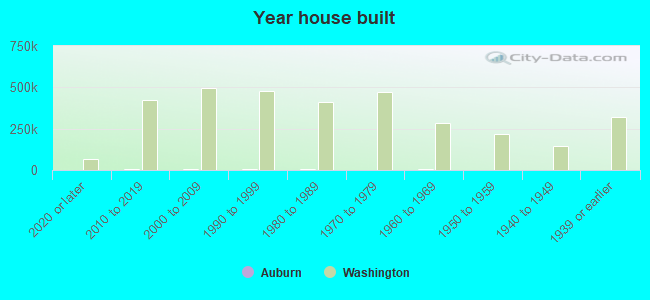
Median year house/condo built: 1990Median year apartment built: 1992Household type by relationship:
Households: 83,976
Male householders: 12,528 (2,197 living alone ), Female householders: 16,828 (4,370 living alone )14,301 spouses (14,006 opposite-sex spouses ), 1,988 unmarried partners , (1,973 opposite-sex unmarried partners ), 29,284 children (28,316 natural , 255 adopted , 713 stepchildren ), 1,319 grandchildren , 1,007 brothers or sisters , 2,020 parents , 90 foster children , 2,150 other relatives , 1,561 non-relatives In group quarters: 900
Size of family households: 8,384 2-persons , 4,563 3-persons , 4,531 4-persons , 1,551 5-persons , 989 6-persons , 1,184 7-or-more-persons .
Size of nonfamily households: 6,567 1-person , 1,526 2-persons , 61 3-persons .
11,894 married couples with children. single-parent households (1,954 men , 7,028 women ).
67.5% of residents of Auburn speak English at home. of residents speak Spanish at home (56% speak English very well , 24% speak English well , 16% speak English not well , 3% don't speak English at all ).of residents speak other Indo-European language at home (58% speak English very well , 20% speak English well , 19% speak English not well , 2% don't speak English at all ).of residents speak Asian or Pacific Island language at home (54% speak English very well , 24% speak English well , 18% speak English not well , 4% don't speak English at all ).of residents speak other language at home (75% speak English very well , 18% speak English well , 4% speak English not well , 3% don't speak English at all ).
Foreign born population: 20,684 (24.6%)of them are naturalized citizens )
Median number of rooms in houses and condos:
Median number of rooms in apartments
Owner-occupied Renter-occupied
Bedrooms in owner-occupied houses and condos in Auburn, Washington
0 no bedroom 348 1 bedroom 3,180 2 bedrooms 8,398 3 bedrooms 3,970 4 bedrooms 1,079 5+ bedrooms
Bedrooms in renter-occupied apartments in Auburn, Washington
671 no bedroom 3,548 1 bedroom 5,250 2 bedrooms 1,006 3 bedrooms 1,259 4 bedrooms 647 5+ bedrooms
Owner-occupied Renter-occupied
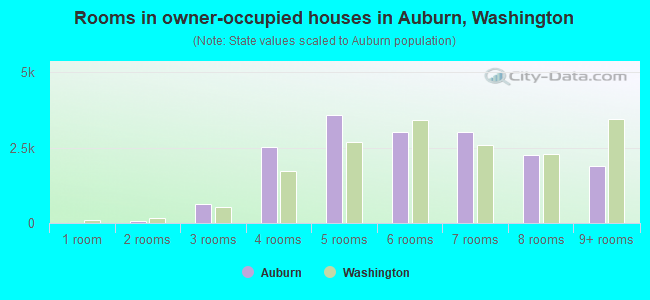
Rooms in owner-occupied houses in Auburn, Washington
0 1 room 79 2 rooms 637 3 rooms 2,508 4 rooms 3,585 5 rooms 3,022 6 rooms 3,012 7 rooms 2,247 8 rooms 1,885 9+ rooms
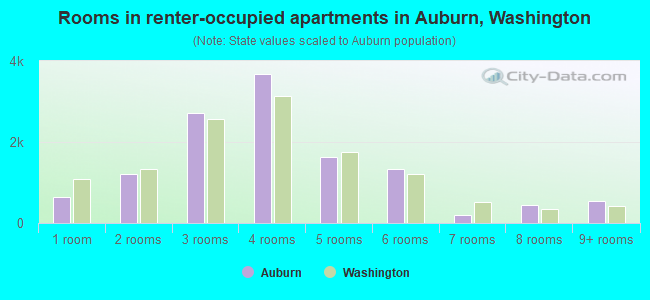
Rooms in renter-occupied apartments in Auburn, Washington
632 1 room 1,215 2 rooms 2,723 3 rooms 3,669 4 rooms 1,638 5 rooms 1,331 6 rooms 201 7 rooms 438 8 rooms 534 9+ rooms
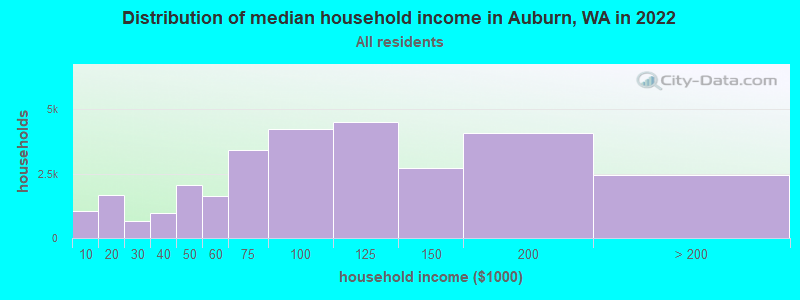
Auburn, WA household income distribution 1,054 Less than $10,0001,666 $10,000 to $19,999648 $20,000 to $29,999955 $30,000 to $39,9992,064 $40,000 to $49,9991,610 $50,000 to $59,9993,395 $60,000 to $74,9994,235 $75,000 to $99,9994,498 $100,000 to $124,9992,732 $125,000 to $149,9994,075 $150,000 to $199,9992,424 $200,000 or more
Home value of owner - occupied houses in 2022 in Auburn, WA 272 Less than $10,00062 $10,000 to $14,999182 $15,000 to $19,999109 $20,000 to $24,99964 $25,000 to $29,999172 $30,000 to $34,99924 $35,000 to $39,999235 $40,000 to $49,999341 $50,000 to $59,99927 $60,000 to $69,999129 $70,000 to $79,999186 $80,000 to $89,99970 $90,000 to $99,999619 $100,000 to $124,999214 $125,000 to $149,999218 $150,000 to $174,99945 $175,000 to $199,999393 $200,000 to $249,999540 $250,000 to $299,9991,517 $300,000 to $399,9992,880 $400,000 to $499,9996,205 $500,000 to $749,9991,046 $750,000 to $999,999232 $1,000,000 to $1,499,99949 $1,500,000 to $1,999,99917 $2,000,000 or moreRent paid by renters in 2022 in Auburn, WA 65 Less than $100173 $100 to $149159 $150 to $199151 $200 to $249100 $250 to $29950 $300 to $349112 $350 to $39914 $450 to $49942 $500 to $54931 $550 to $5997 $600 to $64926 $650 to $69915 $700 to $74979 $750 to $799188 $800 to $899492 $900 to $9992,823 $1,000 to $1,2492,915 $1,250 to $1,4993,800 $1,500 to $1,999852 $2,000 to $2,499148 $2,500 to $2,999267 $3,000 to $3,499186 $3,500 or more382 No cash rent
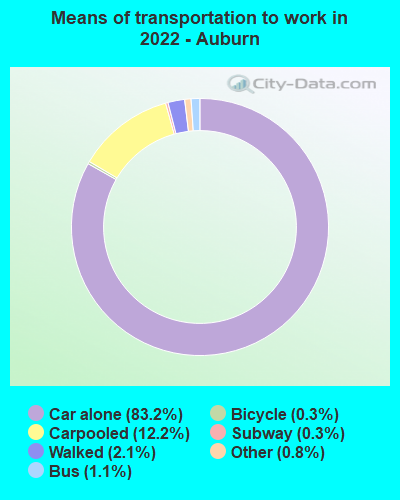
Percentage of workers working in this county: 86.1%Number of people working at home: 6,259 (14.2% of all workers )
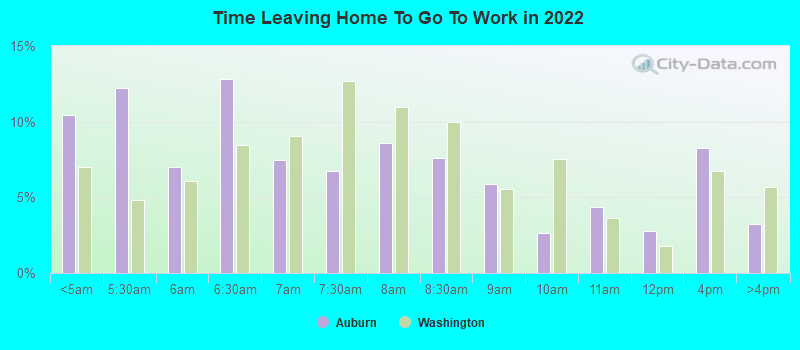
Travel time to work (commute)
Less than 5 minutes: 4435 to 9 minutes: 2,15110 to 14 minutes: 4,27415 to 19 minutes: 4,61720 to 24 minutes: 5,59425 to 29 minutes: 2,11930 to 34 minutes: 5,96635 to 39 minutes: 1,76940 to 44 minutes: 2,06545 to 59 minutes: 3,28060 to 89 minutes: 3,53590 or more minutes: 1,544
Means of transportation to work:
Drove a car alone: 33,696 (72.0%)Carpooled: 4,765 (10.2%)Bus : 277 (0.6%)Long-distance train or commuter rail : 62 (0.1%)Light rail, streetcar or trolley : 10 (0.0%)Taxi: 297 (0.6%)Bicycle: 97 (0.2%)Walked: 748 (1.6%)Worked at home: 6,259 (13.4%)
Unemployment by race in 2022
Unemployment rate for White non-Hispanic residents 2.6% Males2.8% FemalesUnemployment rate for Black residents 1.0% Males8.4% FemalesUnemployment rate for American Indian and Alaska Native residents 6.8% Males10.6% FemalesUnemployment rate for Asian residents 4.7% Males4.3% FemalesUnemployment rate for other race residents 3.2% Males3.6% FemalesUnemployment rate for two or more race residents 4.7% Males3.2% FemalesUnemployment rate for Hispanic or Latino residents 5.3% Males2.4% Females
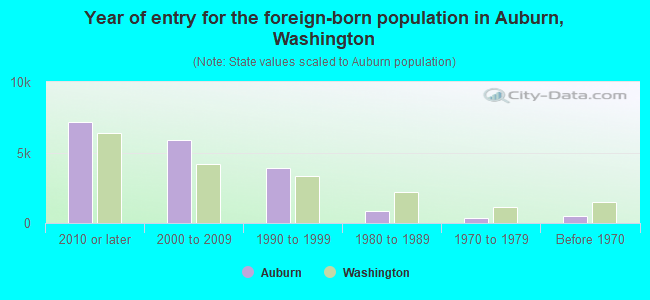
Year of entry for the foreign-born population in Auburn, Washington
7,151 2010 or later 5,870 2000 to 2009 3,934 1990 to 1999 872 1980 to 1989 384 1970 to 1979 486 Before 1970
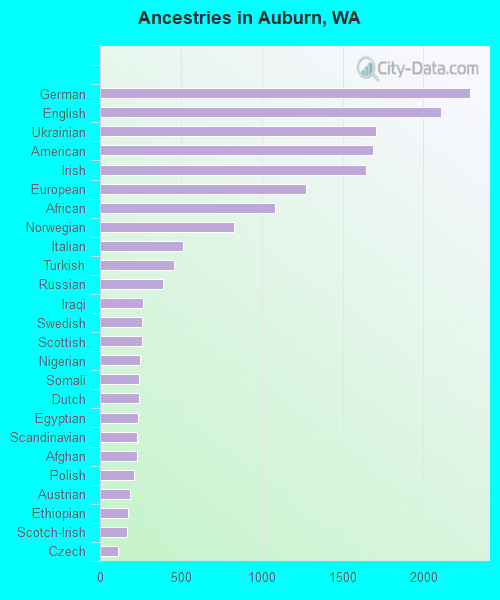
First ancestries reported:
German: 2,291 (5.0%)
English: 2,107 (4.6%)
Ukrainian: 1,709 (3.8%)
American: 1,687 (3.7%)
Irish: 1,645 (3.6%)
European: 1,276 (2.8%)
African: 1,083 (2.4%)
Norwegian: 829 (1.8%)
Italian: 511 (1.1%)
Turkish: 458 (1.0%)
Russian: 389 (0.9%)
Iraqi: 265 (0.6%)
Swedish: 257 (0.6%)
Scottish: 257 (0.6%)
Nigerian: 249 (0.5%)
Somali: 244 (0.5%)
Dutch: 239 (0.5%)
Egyptian: 235 (0.5%)
Scandinavian: 230 (0.5%)
Afghan: 226 (0.5%)
Polish: 213 (0.5%)
Austrian: 185 (0.4%)
Ethiopian: 171 (0.4%)
Scotch-Irish: 166 (0.4%)
Czech: 109 (0.2%)
Jamaican: 92 (0.2%)
French Canadian: 85 (0.2%)
British: 84 (0.2%)
French: 84 (0.2%)
Canadian: 77 (0.2%)
Greek: 76 (0.2%)
Syrian: 73 (0.2%)
Swiss: 72 (0.2%)
Kenyan: 62 (0.1%)
Romanian: 59 (0.1%)
Cajun: 55 (0.1%)
Northern European: 51 (0.1%)
Finnish: 44 (0.10%)
Czechoslovakian: 36 (0.08%)
Sierra Leonean: 35 (0.08%)
Danish: 33 (0.07%)
Moroccan: 32 (0.07%)
British West Indian: 31 (0.07%)
Yugoslavian: 27 (0.06%)
Belgian: 26 (0.06%)
Ghanaian: 25 (0.05%)
Portuguese: 24 (0.05%)
Eastern European: 21 (0.05%)
Icelander: 20 (0.04%)
Bahamian: 20 (0.04%)
Brazilian: 19 (0.04%)
Hungarian: 18 (0.04%)
Welsh: 16 (0.04%)
Armenian: 14 (0.03%)
West Indian: 11 (0.02%)
New Zealander: 10 (0.02%)
Lithuanian: 8 (0.02%)
Pennsylvania German: 7 (0.02%)
Lebanese: 7 (0.02%)
Estonian: 6 (0.01%)
Bulgarian: 4 (0.01%)
Croatian: 3 (0.01%)
Cape Verdean: 3 (0.01%)
Most common places of birth for foreign-born residents (%): Mexico Auburn:
27.1% (5,360)Washington:
21.1% (241,655)
Philippines Auburn:
9.5% (1,873)Washington:
6.3% (71,661)
Ukraine Auburn:
6.4% (1,272)Washington:
3.1% (35,872)
Korea Auburn:
5.3% (1,056)Washington:
4.3% (48,886)
Vietnam Auburn:
4.9% (975)Washington:
5.4% (62,003)
India Auburn:
4.8% (956)Washington:
8.9% (101,353)
Kenya Auburn:
4.2% (831)Washington:
1.1% (12,735)
China, excluding Hong Kong and Taiwan Auburn:
2.8% (563)Washington:
7.4% (84,470)
Russia Auburn:
2.6% (518)Washington:
1.9% (21,540)
Marshall Islands Auburn:
2.2% (432)Washington:
0.3% (3,048)
Iraq Auburn:
1.8% (348)Washington:
0.5% (6,259)
Place of birth for U.S.-born residents:
This state: 39,317Other state: 20,760Northeast: 1,790Midwest: 3,595South: 3,355West: 12,020 89.6% of Auburn residents lived in the same house 1 years ago.
Out of people who lived in different houses, 36.3% lived in this county.
Out of people who lived in different counties, 67.9% lived in Washington.
Auburn:
89.6%State average:
85.2%
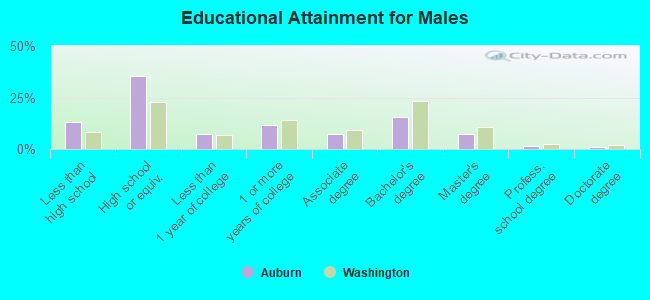
Education attainment for males 25 years and older:
No schooling: 1,547Nursery to 4th grade: 395th and 6th grade: 07th and 8th grade: 599th grade: 1710th grade: 33011th grade: 55412th grade, no diploma: 856High school graduate (or equivalency): 9,054Less than 1 year of college: 1,918Some college more than 1 year, no degree: 3,000Associate degree: 1,847Bachelor's degree: 3,979Master's degree: 1,882Professional school degree: 385Doctorate degree: 212
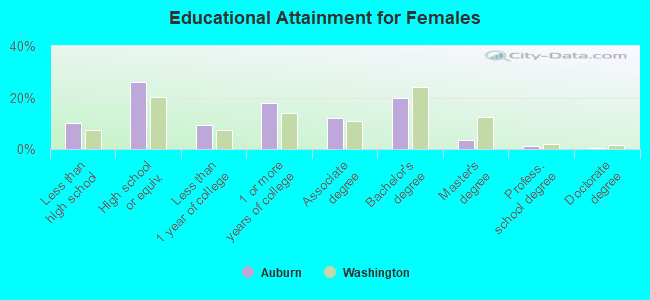
Education attainment for females 25 years and older:
No schooling: 674Nursery to 4th grade: 675th and 6th grade: 2217th and 8th grade: 2699th grade: 45810th grade: 58511th grade: 21312th grade, no diploma: 347High school graduate (or equivalency): 7,315Less than 1 year of college: 2,586Some college more than 1 year, no degree: 4,989Associate degree: 3,401Bachelor's degree: 5,500Master's degree: 938Professional school degree: 273Doctorate degree: 88
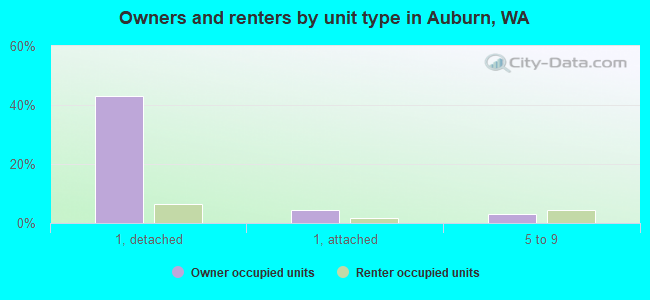
Housing units in structures:
One, detached: 14,532One, attached: 1,754Two: 9103 or 4: 2,4675 to 9: 2,21310 to 19: 1,95020 to 49: 2,35450 or more: 2,406Mobile homes: 2,018Median worth of mobile homes: $104,400
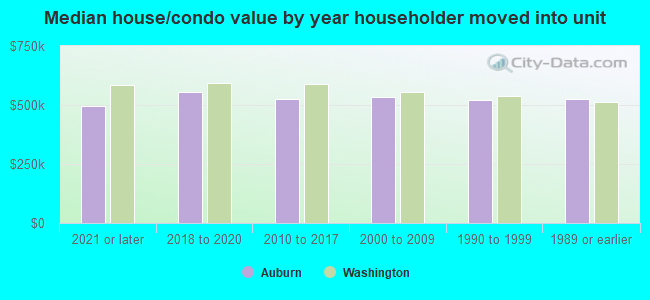
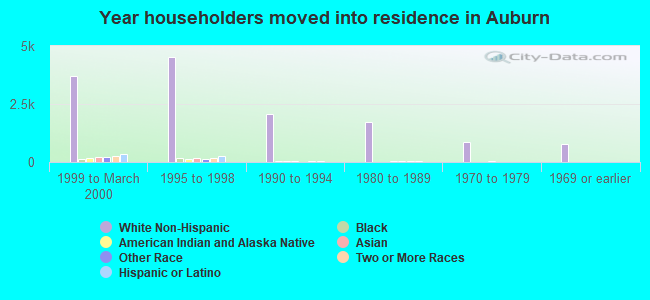
Housing units lacking complete plumbing facilities in 2022: 1.0%Housing units lacking complete kitchen facilities in 2022: 1.2%House/condo owner moved in on average 9 years ago
Renter moved in on average 3 years ago
Private vs. public school enrollment:
Students in private schools in grades 1 to 8 (elementary and middle school): 412 Here:
4.3%Washington:
12.4%
Students in private schools in grades 9 to 12 (high school): 454 Students in private undergraduate colleges: 532 Here:
22.8%Washington:
16.5%