Barnegat, NJ (New Jersey) Houses and Residents
| Barnegat: | $373,104 |
| New Jersey: | $428,900 |
Mean price in 2022:
Detached houses: $391,413
Here: $391,413 State: $537,591 Townhouses or other attached units: $459,699
Here: $459,699 State: $381,113
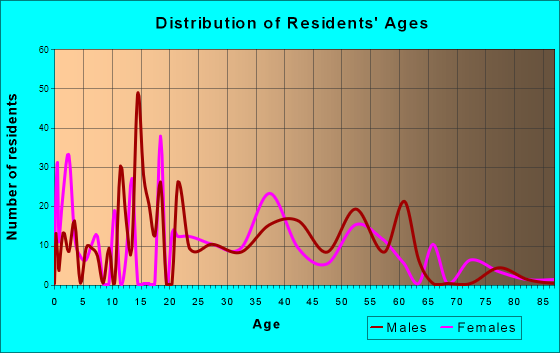
Total population: 2,817 (Urban population: 1,550, Rural population: 83 (all nonfarm))
Houses: 1,386 (1,211 occupied: 1,033 owner occupied, 182 renter occupied)
| % of renters here: | 15% |
| State: | 35% |
Housing density: 518 houses/condos per square mile
Median price asked for vacant for-sale houses and condos in 2022 in this county: $113,957.
Median contract rent in 2022: $1,440 (lower quartile is $1,053, upper quartile is $1,942)
Median rent asked for vacant for-rent units in 2022: $1,168
Median gross rent in Barnegat, NJ in 2022: $1,600
Housing units in Barnegat with a mortgage: 847 (46 second mortgage, 0 home equity loan, 47 both second mortgage and home equity loan)
Houses without a mortgage: 154
Median household income for houses/condos with a mortgage: $126,412
Median household income for apartments without a mortgage: $91,997
Median monthly housing costs: $1,956
Compare current foreclosures in Barnegat, NJ:
| Photo | Address | Area | Beds / Baths | Price | Details |
|---|---|---|---|---|---|

|
#1
Bowline St
Barnegat, NJ 08005
|
1,252 sq. feet
|
2 baths 3 beds |
show details | |

|
#2
Freedom Hills Dr
Barnegat, NJ 08005
|
3,063 sq. feet
|
- baths - beds |
show details | |

|
#3
Emerald Dr # B
Barnegat, NJ 08005
|
1,025 sq. feet
|
- baths - beds |
show details | |

|
#4
Longboat Ave
Barnegat, NJ 08005
|
1,550 sq. feet
|
- baths - beds |
show details | |

|
#5
Nautilus Dr
Barnegat, NJ 08005
|
2,868 sq. feet
|
- baths - beds |
show details | |

|
#6
Pomona Dr
Barnegat, NJ 08005
|
2,652 sq. feet
|
- baths - beds |
show details | |

|
#7
Savannah Dr
Barnegat, NJ 08005
|
- sq. feet
|
- baths - beds |
show details | |

|
#8
S Main St # 214
Barnegat, NJ 08005
|
- sq. feet
|
- baths - beds |
show details | |

|
#9
Anchor Rd
Barnegat, NJ 08005
|
950 sq. feet
|
- baths - beds |
show details | |

|
#10
Village Dr
Barnegat, NJ 08005
|
1,292 sq. feet
|
- baths - beds |
show details |
| Photo | Address | Area | Beds / Baths | Price | Details |
|---|---|---|---|---|---|

|
#11
Jon Dr
Barnegat, NJ 08005
|
2,286 sq. feet
|
- baths - beds |
show details | |

|
#12
Schooner Ave
Barnegat, NJ 08005
|
1,744 sq. feet
|
- baths - beds |
show details | |

|
#13
Deer Run Dr N
Barnegat, NJ 08005
|
1,364 sq. feet
|
- baths - beds |
show details | |

|
#14
Barnegat Blvd S
Barnegat, NJ 08005
|
1,528 sq. feet
|
- baths - beds |
show details | |

|
#15
Nautilus Ave
Barnegat, NJ 08005
|
1,542 sq. feet
|
- baths - beds |
show details | |

|
#16
Rockrimmon Blvd
Barnegat, NJ 08005
|
- sq. feet
|
- baths - beds |
show details | |

|
#17
Schooner Ave
Barnegat, NJ 08005
|
1,642 sq. feet
|
- baths - beds |
show details | |

|
#18
Emerald Dr # B
Barnegat, NJ 08005
|
1,336 sq. feet
|
- baths - beds |
show details | |

|
#19
Mast Dr
Barnegat, NJ 08005
|
1,224 sq. feet
|
- baths - beds |
show details | |

|
#20
Nautilus Dr
Barnegat, NJ 08005
|
- sq. feet
|
- baths - beds |
show details |
| Photo | Address | Area | Beds / Baths | Price | Details |
|---|---|---|---|---|---|

|
#21
Mast Dr
Barnegat, NJ 08005
|
1,674 sq. feet
|
- baths - beds |
show details | |

|
#22
Schooner Ave
Barnegat, NJ 08005
|
1,576 sq. feet
|
- baths - beds |
show details | |

|
#23
Anchor Rd
Barnegat, NJ 08005
|
975 sq. feet
|
- baths - beds |
show details | |

|
#24
Portland St
Barnegat, NJ 08005
|
- sq. feet
|
- baths - beds |
show details | |

|
#25
Chesapeake Ct
Barnegat, NJ 08005
|
816 sq. feet
|
- baths - beds |
show details | |

|
#26
E Bay Ave
Barnegat, NJ 08005
|
884 sq. feet
|
- baths - beds |
show details | |

|
#27
Lexington Blvd
Barnegat, NJ 08005
|
- sq. feet
|
- baths - beds |
show details | |

|
#28
1st St
Barnegat, NJ 08005
|
1,952 sq. feet
|
- baths - beds |
show details | |

|
#29
Longboat Ave
Barnegat, NJ 08005
|
1,179 sq. feet
|
- baths - beds |
show details | |

|
#30
Freedom Hills Dr
Barnegat, NJ 08005
|
2,177 sq. feet
|
- baths - beds |
show details |
| Photo | Address | Area | Beds / Baths | Price | Details |
|---|---|---|---|---|---|

|
#31
Mizzen Dr
Barnegat, NJ 08005
|
- sq. feet
|
- baths - beds |
show details | |

|
#32
Watts Ave
Barnegat, NJ 08005
|
2,906 sq. feet
|
- baths - beds |
show details | |

|
#33
Lexington Blvd
Barnegat, NJ 08005
|
910 sq. feet
|
- baths - beds |
show details | |

|
#34
Midship Dr
Barnegat, NJ 08005
|
1,548 sq. feet
|
- baths - beds |
show details | |

|
#35
Pennsylvania Ave
Barnegat, NJ 08005
|
2,302 sq. feet
|
- baths - beds |
show details | |

|
#36
Chesapeake Ct
Barnegat, NJ 08005
|
816 sq. feet
|
- baths - beds |
show details | |

|
#37
E Bay Ave
Barnegat, NJ 08005
|
1,498 sq. feet
|
- baths - beds |
show details | |

|
#38
Hatteras Rd
Barnegat, NJ 08005
|
1,824 sq. feet
|
- baths - beds |
show details | |

|
#39
Osprey Pl
Barnegat, NJ 08005
|
1,554 sq. feet
|
- baths - beds |
show details | |

|
#40
Pennsylvania Ave
Barnegat, NJ 08005
|
2,516 sq. feet
|
- baths - beds |
show details |
| Photo | Address | Area | Beds / Baths | Price | Details |
|---|---|---|---|---|---|

|
#41
Bay Shore Dr
Barnegat, NJ 08005
|
- sq. feet
|
- baths - beds |
show details | |

|
#42
Hearth Ct
Barnegat, NJ 08005
|
1,488 sq. feet
|
- baths - beds |
show details | |

|
#43
Bayberry Ct
Barnegat, NJ 08005
|
2,030 sq. feet
|
- baths - beds |
show details | |

|
#44
1st St
Barnegat, NJ 08005
|
2,345 sq. feet
|
- baths - beds |
show details | |

|
#45
Bay Shore Dr
Barnegat, NJ 08005
|
- sq. feet
|
- baths - beds |
show details | |

|
#46
Cannonball Dr
Barnegat, NJ 08005
|
2,048 sq. feet
|
- baths - beds |
show details | |

|
#47
Mission Way
Barnegat, NJ 08005
|
1,899 sq. feet
|
- baths - beds |
show details | |

|
#48
Barnegat Blvd S
Barnegat, NJ 08005
|
1,528 sq. feet
|
- baths - beds |
show details | |

|
#49
Nautilus Ave
Barnegat, NJ 08005
|
1,542 sq. feet
|
- baths - beds |
show details | |

|
Check over 1 million property listings on Foreclosure.com!
|
browse all offers | |||

Latest news about housing in Barnegat, NJ collected exclusively by city-data.com from local newspapers, TV, and radio stations

 | Cost Differences in starter homes South vs North New Jersey (6 replies) |
| Ryan Homes Townhouses in Swedesboro (126 replies) |
| Four Seasons at Mirage,were defects in homes repaired? (8 replies) |
| Barnegat NJ, specifically Settler's Landing (2 replies) |
| Ryan Homes - Christopher Estates at Hamilton (60 replies) |
| Murphy's Offshore Wind Project CANCELLED! (35 replies) |
Median year apartment built: 1999
Household type by relationship:
Households: 3,371- Male householders: 733 (75 living alone), Female householders: 503 (58 living alone)
906 spouses (906 opposite-sex spouses), 101 unmarried partners, (101 opposite-sex unmarried partners), 1,027 children (1,005 natural, 0 adopted, 22 stepchildren), 56 grandchildren, 0 brothers or sisters, 43 parents, 0 foster children, 0 other relatives, 0 non-relatives
Size of family households: 531 2-persons, 170 3-persons, 331 4-persons, 40 5-persons, 20 6-persons.
Size of nonfamily households: 124 1-person, 29 2-persons.
552 married couples with children.
177 single-parent households (110 men, 67 women).
92.8% of residents of Barnegat speak English at home.
2.8% of residents speak Spanish at home (100% speak English very well).
1.4% of residents speak other Indo-European language at home (26% speak English very well, 43% speak English well, 31% speak English not well).
2.2% of residents speak Asian or Pacific Island language at home (100% speak English very well).
Foreign born population: 111 (3.3%)
(55.0% of them are naturalized citizens)
| Here: | 7.3 |
| State: | 6.8 |
| Here: | 4.4 |
| State: | 3.9 |

- Bedrooms in owner-occupied houses and condos in Barnegat, New Jersey
- 0no bedroom
- 231 bedroom
- 572 bedrooms
- 3033 bedrooms
- 5874 bedrooms
- 645+ bedrooms

- Bedrooms in renter-occupied apartments in Barnegat, New Jersey
- 0no bedroom
- 831 bedroom
- 532 bedrooms
- 473 bedrooms
- 04 bedrooms
- 05+ bedrooms

- Cars and other vehicles available in Barnegat in owner-occupied houses/condos
- 0no vehicle
- 531 vehicle
- 6192 vehicles
- 1883 vehicles
- 1134 vehicles
- 615+ vehicles

- Cars and other vehicles available in Barnegat in renter-occupied apartments
- 0no vehicle
- 1211 vehicle
- 442 vehicles
- 173 vehicles
- 04 vehicles
- 05+ vehicles

- Rooms in owner-occupied houses in Barnegat, New Jersey
- 01 room
- 02 rooms
- 233 rooms
- 04 rooms
- 765 rooms
- 1606 rooms
- 3127 rooms
- 2348 rooms
- 2289+ rooms

- Rooms in renter-occupied apartments in Barnegat, New Jersey
- 01 room
- 222 rooms
- 253 rooms
- 584 rooms
- 305 rooms
- 06 rooms
- 07 rooms
- 358 rooms
- 129+ rooms


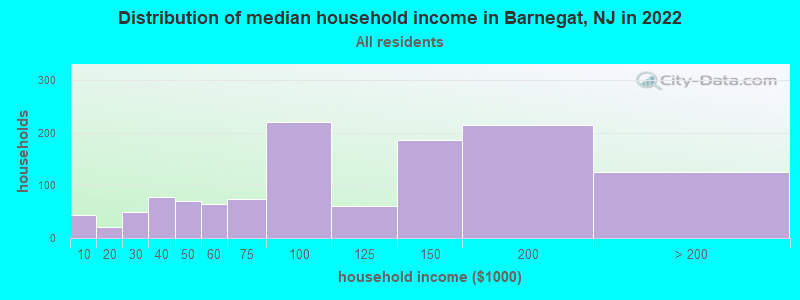
Barnegat, NJ household income distribution

- 43Less than $10,000
- 20$10,000 to $19,999
- 50$20,000 to $29,999
- 78$30,000 to $39,999
- 71$40,000 to $49,999
- 65$50,000 to $59,999
- 74$60,000 to $74,999
- 220$75,000 to $99,999
- 60$100,000 to $124,999
- 186$125,000 to $149,999
- 214$150,000 to $199,999
- 125$200,000 or more
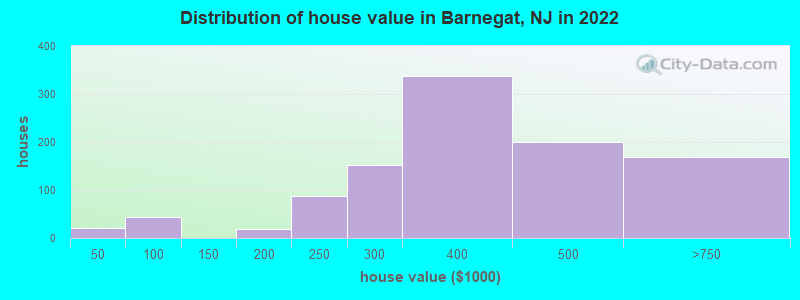
Home value of owner - occupied houses in 2022 in Barnegat, NJ
-
- 21$40,000 to $49,999
- 22$50,000 to $59,999
- 18$150,000 to $174,999
- 86$200,000 to $249,999
- 152$250,000 to $299,999
- 338$300,000 to $399,999
- 199$400,000 to $499,999
- 167$500,000 to $749,999
Rent paid by renters in 2022 in Barnegat, NJ
-
- 35$200 to $249
- 12$800 to $899
- 22$1,000 to $1,249
- 33$1,250 to $1,499
- 40$1,500 to $1,999
- 36$2,000 to $2,499

Percentage of workers working in this county: 79.5%
Number of people working at home: 69 (4.1% of all workers)
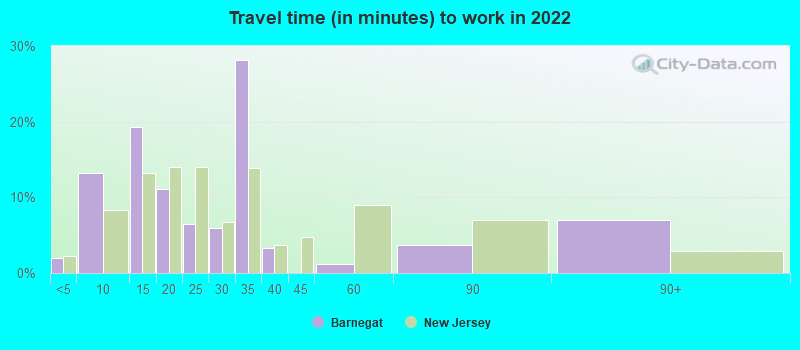
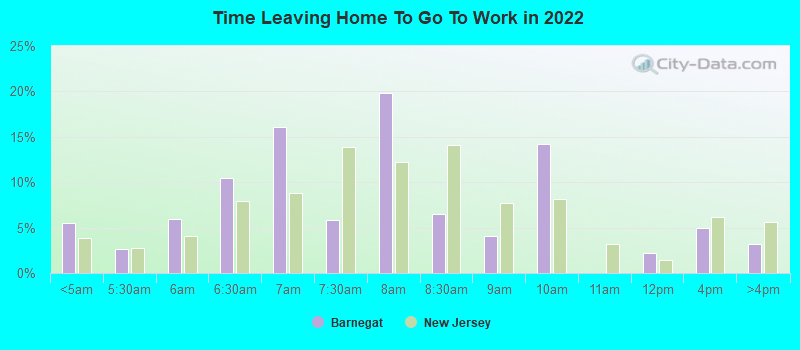
Travel time to work (commute)
- Less than 5 minutes: 0
- 5 to 9 minutes: 258
- 10 to 14 minutes: 269
- 15 to 19 minutes: 186
- 20 to 24 minutes: 134
- 25 to 29 minutes: 114
- 30 to 34 minutes: 247
- 35 to 39 minutes: 33
- 40 to 44 minutes: 11
- 45 to 59 minutes: 90
- 60 to 89 minutes: 133
- 90 or more minutes: 107
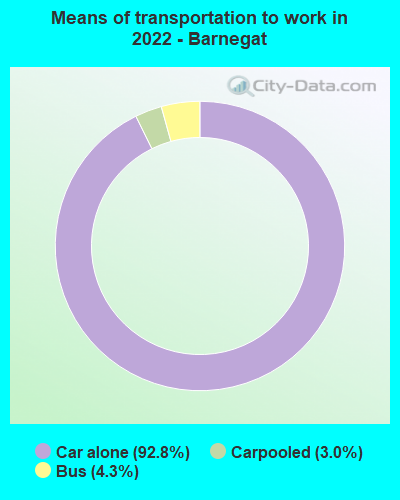
Means of transportation to work:
- Drove a car alone: 947 (83.9%)
- Carpooled: 34 (3.0%)
- Bus: 34 (3.0%)
- Worked at home: 69 (6.1%)
- Unemployment by race in 2022
- Unemployment rate for White non-Hispanic residents
- 5.7%Females
- Unemployment rate for two or more race residents
- 100.0%Males

- Year of entry for the foreign-born population in Barnegat, New Jersey
- 422010 or later
- 542000 to 2009
- 101990 to 1999
- 181980 to 1989
- 121970 to 1979
- 22Before 1970

First ancestries reported:
- Italian: 440 (40.4%)
- American: 145 (13.3%)
- German: 132 (12.1%)
- Irish: 100 (9.2%)
- Polish: 84 (7.7%)
- English: 44 (4.0%)
- Russian: 40 (3.7%)
Most common places of birth for foreign-born residents (%):
| Barnegat: | 29.7% (33) |
| New Jersey: | 4.0% (85,934) |
| Barnegat: | 27.0% (30) |
| New Jersey: | 2.1% (46,020) |
| Barnegat: | 21.6% (24) |
| New Jersey: | 0.1% (2,405) |
| Barnegat: | 13.5% (15) |
| New Jersey: | 3.7% (78,969) |
Place of birth for U.S.-born residents:
- This state: 2,723
- Other state: 440
- Northeast: 405
- Midwest: 20
- South: 16
- West: 0
97.0% of Barnegat residents lived in the same house 1 years ago.
Out of people who lived in different houses, 49.0% lived in this county.
| Barnegat: | 97.0% |
| State average: | 90.4% |
Education attainment for males 25 years and older:
- No schooling: 0
- Nursery to 4th grade: 0
- 5th and 6th grade: 0
- 7th and 8th grade: 0
- 9th grade: 0
- 10th grade: 11
- 11th grade: 0
- 12th grade, no diploma: 87
- High school graduate (or equivalency): 330
- Less than 1 year of college: 44
- Some college more than 1 year, no degree: 139
- Associate degree: 66
- Bachelor's degree: 353
- Master's degree: 118
- Professional school degree: 24
- Doctorate degree: 25

Education attainment for females 25 years and older:
- No schooling: 16
- Nursery to 4th grade: 0
- 5th and 6th grade: 22
- 7th and 8th grade: 0
- 9th grade: 0
- 10th grade: 0
- 11th grade: 0
- 12th grade, no diploma: 14
- High school graduate (or equivalency): 286
- Less than 1 year of college: 148
- Some college more than 1 year, no degree: 54
- Associate degree: 108
- Bachelor's degree: 445
- Master's degree: 72
- Professional school degree: 0
- Doctorate degree: 21

Housing units in structures:
- One, detached: 1,127
- One, attached: 113
- 3 or 4: 38
- 5 to 9: 29
- 10 to 19: 54
- 50 or more: 23
House/condo owner moved in on average 7 years ago
Renter moved in on average 3 years ago

Private vs. public school enrollment:
| Here: | 10.9% |
| New Jersey: | 12.3% |
| Here: | 0.0% |
| New Jersey: | 13.1% |
| Here: | 33.7% |
| New Jersey: | 33.2% |


